MULTIMEDIA
RESOURCES
Images, Graphics & Design, Audio & Music, Video, Animation, Themes, Plugins, Code, Apps, Tools, Education, Jobs, Buy & Sell Art, Communities
HOT
- The Coin Show Business EXPERIENCE: Master the art of organizing, marketing, and profiting from coin shows. Numismatics Guide.
- EnvatoLabs: A full stack of powerful AI tools. Top-tier gen AI models, commercial use, ever-evolving tools, inspirational resources. Images-Videos-Music-VoiceGenerator-Graphics. Overview
- ChicMe: Price Drop Madness. Buy 1 Get 1 FREE. Overview
- Soundop: Professional Audio Workstation for Seamless Audio Production. Overview
- TEFL: The TEFL Institute of Ireland. Prestigious Level 5 Ofqual UK Government Regulated courses online. Overview
- Movavi: *NEW Video Suite 2025. Video editor, media converter, screen recorder and more. Overview
- Game: Playstation, Xbox, Nintendo, PC, accessories, tech, toys, board games, trading cards, and more.
- DreamHost: Web Hosting With Purpose. Get a Website Built for You — 100% Free. No design skills. No builders. No hassle. Just results. Overview. Exclusive WMS Bonus
CLICK ON AN ICON OR TITLE BELOW TO CHOOSE A CATEGORY
A-Z Index
FREE STOCK PHOTOS
FREE STOCK VIDEOS
VIDEO MARKETING
SPONSORED ADVERTISEMENT
SITES
0-9
- 0to255: a color tool that makes it easy to lighten and darken colors. It’s perfect for hover states, borders, gradients, and more.
- 1001fonts: huge library of fonts
- 1001FreeDownloads: Downloads thousands of royalty free graphics and fonts for personal and commercial use!
- 123FreeVectors: Largest Collection of Free Vector Art, Vector Images, Vector Graphic Resources, Clip Art, Illustrations, Wallpaper Background Designs for All Free Downloads.
- 3DgraphicsBox: design your own animations and graphics (avatars, logos, covers, kindle book covers, infographics, background images, and so much more)
- 500px: photo marketplace (buy and sell). Overview.
SPONSORED ADVERTISEMENT
SITES
A
- Acorn: photo editing app.
- Adazing: Free book cover maker.
- Adobe: a suite of programs and tools for multimedia producers. AdobeAcrobat: the most complete PDF solution for today’s multidevice world. It connects you to your documents, team, and favorite PDF tools. AdobeAfterEffects: Create cinematic movie titles, intros, and transitions. Remove an object from a clip. Start a fire or make it rain. Animate a logo or character. Even navigate and design in a 3D space. AdobeAnimate: Design interactive animations for games, TV shows, and the web. Bring cartoons and banner ads to life. Create animated doodles and avatars. And add action to eLearning content and infographics. AdobeAudition: Create, mix, and design sound effects with the industry’s best digital audio editing software. AdobeAuditionDownloads: thousands of uncompressed, royalty-free audio sound effects and music loop files. These files have been grouped together by type and style into ZIP archives that can be downloaded. AdobeBridge: a powerful creative asset manager that lets you preview, organize, edit, and publish multiple creative assets quickly and easily. Edit metadata. Add keywords, labels, and ratings to assets. Organize assets using collections, and find assets using powerful filters and advanced metadata search features. AdobeCharacterAnimator: uses your expressions and movements to animate characters in real time. It’s so fast, you can livestream while you work to wow audiences every step of the way. AdobeColorWheel: color inspiration. AdobeDimension: Create engaging content in 3D faster with high-quality models, materials, and lighting. Dimension makes it easy to build brand visualizations, illustrations, product mockups, packaging designs, and other creative work. AdobeDreamweaver: Quickly create and publish web pages almost anywhere with web design software that supports HTML, CSS, JavaScript, and more. AdobeExpress: Make a free project with Adobe Express. Our free plan includes thousands of unique templates, design assets, Adobe Stock royalty-free photos, and more. Available on web and mobile. Edit images and videos on the go. Fast and free editing for images, videos, and documents is just a click away with our Quick Actions. Resize content, convert files, and add effects in seconds. AdobeFresco: brings together the world’s largest collection of vector and raster brushes, plus revolutionary live brushes, to deliver a completely natural painting and drawing experience. For artists, illustrators, animators, sketchers, and anyone who wants to discover, or rediscover, the joy of drawing and painting. AdobeIllustrator: The industry-standard vector graphics software lets you create everything from web and mobile graphics to logos, icons, book illustrations, product packaging, and billboards. AdobeInCopy: lets copywriters and editors style text, track changes, and make simple layout modifications to a document while designers work on the same document simultaneously in Adobe InDesign — all without overwriting each other’s contributions. AdoneInDesign: the industry-leading layout and page design software for print and digital media. Create beautiful graphic designs with typography from the world’s top foundries and imagery from Adobe Stock. Quickly share content and feedback in PDF. Easily manage production with Adobe Experience Manager. InDesign has everything you need to create and publish books, digital magazines, eBooks, posters, interactive PDFs, and more. AdobeLightroom: the cloud-based service that gives you everything you need to create, edit, organize, store, and share your photos across any device. AdobeMediaEncoder: Ingest, transcode, create proxies, and output to almost any format you can imagine. Automate your workflows with presets, Watch Folders, and Destination Publishing. Use Time Tuner to invisibly adjust duration, and apply LUTs and Loudness corrections without having to re-open projects. Tight integration with Adobe Premiere Pro, After Effects, and other applications provides a seamless workflow. AdobePhotoshop: From photo editing and compositing to digital painting, animation, and graphic design — you can do it all in Photoshop. Bring ideas to life across desktop and iPad. Magically transform images with the power of AI. Learn new skills and share your projects via live stream. AdobePhotoshopElements: edit photos, create slideshows and collages. AdobePhotoshopExpress: edit photos, make collages. AdobePrelude: Rapidly tag and transcode video footage and quickly create a rough cut with Prelude — a video logging and ingest tool designed for intuitive, efficient media organization and metadata entry. Prelude translates effortlessly into Adobe Premiere Pro, ensuring fluid communication and organization throughout the video production process. AdobePremiere: Premiere Pro is the industry-leading video editing software for film, TV, and the web. Creative tools, integration with other apps and services, and the power of Adobe Sensei help you craft footage into polished films and videos. And with the Premiere Rush app, you can create and edit new projects from any device. AdobePremierRush: all-in-one video editing app for creating on the go. Wherever you are, from your phone to your computer, you can shoot, edit, and share high-quality videos. AdobeSpark: photo animation, create social graphics, web pages, and short videos. Over 41,000 assets and templates, tutorials, support. Overview. AdobeStock: Explore diverse collections of the most incredible high-resolution, royalty-free, stock assets. AdobeSubstance: Inspiring, intelligent tools and content for creating 3D textures and materials. AdobeXD: Share your story with designs that look and feel like the real thing. Wireframe, animate, prototype, collaborate, and more.
- AdultGuitarLessons: easily overcome the challenges of learning how to play guitar “Later in Life”
- AdvancingGuitaristProgram: discover the secrets most guitar players will never know
- AiConica: 1141 free icons downloaded more than 150,000 times.
- All-Free-Download: best free download resources for designers
- All The Free Stock: *One of my very favorite multimedia tools. A very handy search engine that can save you valuable time. The database is huge! Departments: free stock photos, free mockups, free stock videos, free sound effects, color inspiration, free website templates, free fonts, free icons, free email templates, free illustrations, free patterns, food pics, email list, placeholder.
- Angle.sh: Vector and 3D device mockups for Sketch, Figma and XD, tutorials.
- Animoto: Easily create professional videos. Drag-and-drop editing tools and visual effects. Various types and industries, templates, stock library, music library, upload, voice over, and much more.
- AnyChart: Interactive JavaScript charts designed to be embedded and integrated into web, desktop, and mobile apps
- AppSheet: Create apps to transform your workplace. Part of Google Cloud.
- ArchetypeApp: an online tool that helps you create consistent typography styling and spacing for all of your digital projects
- Artify: A super intuitive web design editor packed with a huge library of design assets you’ll love (the same team behind Iconshock & ByPeople)
- ArtPal: art, prints, framing (marketplace – buy and sell products)
- Audacity: a free and open-source digital audio editor and recording application software, available for Windows, macOS, Linux, and other Unix-like operating systems.
- AudioBlocks: Unlimited Royalty-Free Music & SFX. Download all the music, sound effects, and loops you need with a low-cost subscription.
- AudioVideoWholesaler: Your Direct Source For Multimedia Products, Audio, Music, Video Courses Products @ Wholesale Price
- Awwwards: The awards that recognize the talent and effort of the best web designers, developers and agencies in the world. eBooks & publications, winners, nominees, collections, professional directory, jobs & talent, freebies.
SPONSORED
ABSOLUTECOVERS
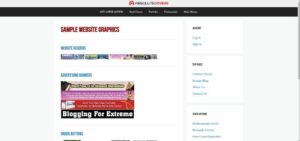
Free eBook Cover Generator & Professional Graphics
Products:
- Website headers
- Advertising banners
- Order buttons
- Favourite icons
- Website graphics
- Web covers: eBook, newsletter, software box, membership card, multiproduct
- Print covers: book, DVD, magazine, dust jacket
Other departments: Blog, special offers.
About: Founded in 2001 by Ovi Dogar.
SPONSORED
AVS4YOU
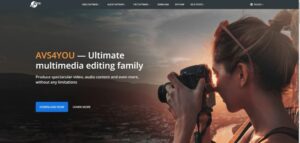
Ultimate Multimedia Editing Family
Main slogan: Produce spectacular video, audio content and even more, without any limitations
Products:
- Video Software: AVS Video Editor, AVS Video Converter (Free), AVS Video Remaker
- Audio Software: AVS AAudio Editor, AVS Audio Converter (Free)
- Free Software: AVS Media Player, AVS Image Converter
Other departments: Help, guides, knowledge center, FAW, resellers, education, blog.
About: 150+ staff members, millions of customers, 200+ countries sold in. Riga, Latvia. Ascensio System SIA.
SPONSORED ADVERTISEMENT
SITES
B
- BEAUBUS Patterns: A set of 150+ free SVG patterns for you to use on your projects.
- BeeFree: drag & drop editor for designing mobile responsive emails Overview
- BeFunky: online photo editor, collage maker, graphic designer app BeFunky full review
- BGjar: Free svg background generator for your websites, blogs and app.
- Behance: arts, photography, web design (marketplace). Overview.
- BigCartel: online stores for artists and makers (marketplace). Full review
- BiteAble: video creation app with templates.
- Blend: Create and customize beautiful CSS3 gradients
- Blender: Open source 3D creation. Free to use for any purpose, forever.
- BluesBassForGuitarPlayers: a step-by-step system for creating perfect blues bass lines every time
- BluesJamSession: 60 blues jam tracks, 3 hours of video lessons, and improvisation guides with Peter Morales
- Blush: Free illustrations for everyone, Create, mix, and customize illustrations made by artists around the world.
- BootFlat: a UI color picker, perfect colors for flat designs
- BrandColors: the biggest collection of official brand color codes around
- BrightRiver: edit photos and videos, 3D modeling
- Brusheezy: free photoshop brushes & PSD’s, you can become a contributor
- BSZphototutorial: Everything you need to know to start improving your style and efficiency with your editing.
- BTVsolo: professional music production software, award-winning
- BXFR: an elaboration of the glorious Sfxr, the program of choice for many people looking to make sound effects for computer games
- ByPeople: hand-curated premium packs & freebies (plugins, fonts, themes, icons)
- ByteSizeIcons: a tiny style-controlled SVG iconset on github.
SPONSORED
BILLO
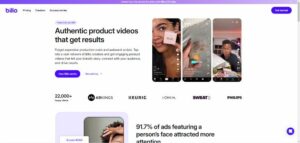
Authentic Product Videos that Get Results
Videos from 5,000+ creators:
- Health & wellness, fashion
- Apps and digital services, automotive, family and children
- Tech and gadgets, cosmetics and beauty, food and beverage
- Home and lifestyle, pets,
- and much more
Videos for social platforms (mainly):
- TikTok
- and more
Other departments: Blog, creators, help, careers.
About: 200,000 videos created, 22,000 brands served, 50+ team members, San Fransisco, CA, USA.
SPONSORED ADVERTISEMENT

SITES
C
- CabanaDesignSystem: A Design System for Sketch that enables ycou to create UIs quicker, which means you can present your design ideas much faster.
- CafePress: marketplace. Departments: products, interests, recipients, occasions, shop sale, gift center, design your own, start selling. Overview.
- CalColor: Calculate colors, share palettes
- Calligraphr: transform your handwriting or calligraphy into a font
- Canva: design maker. Visual documents: visual suite, docs, presentations, whiteboards, PDF editor, graphics and charts. Photos and videos: video editor, YouTube, photo editor, photo collages. Print: business cards, cards, invitations, mugs, t-shirt, hoodies, calendars, labels. Marketing: logos, posters, flyers, brochures, social media, websites, stickers, yard signs, QR code generator. Platform: Magic Studio, projects, templates, brand, apps. Resources: business, case studies, features, integrations, help. Education: teachers and schools, students, lessons, LMS integrations, case studies, higher education. Learn: blog, design school, events. Launched in 2013, 130M+ MAUs, 15B+ designs created, 190 countries, 100+ languages.
- Ceacle: creative tools, mockups, showcase, brief, cloudstore, modular programming platform
- Cerberus: A few simple, but solid patterns for responsive HTML emails. Even in Outlook and Gmail.
- ChangeLog: News and podcasts for developers, community
- Character-e: 2500+premium quality character assets
- ChromeCapture: Take a video, snapshot or create a GIF of your screen and annotate it.
- Classical-Guitar: classical guitar sheet, music scores download by Richard Miles Jackman
- ClipDrop: capture and transfer anything around you. Extract objects, drawings, and text. Capture directly from your desktop and drag & drop it to any other app.
- CMYKbrand: tools for creativity
- CodeGat: learn how to make beats in only 30 minutes with the codegat fl studio guide
- CodeInWP: a hub for WordPress freelancers, bloggers, and creators, guides
- CodeMyUI: Web Design & UI Inspiration with Code Snippets
- Codota: AI completions for your Java IDE. Code faster and smarter using code completions learned from millions of programs directly in IntelliJ, Android Studio or Eclipse
- CohesiveColors: create cohesive color schemes
- Color-Hex: information about colors including color models (RGB, HSL, HSV, and CMYK), Triadic colors, monochromatic colors, and analogous colors calculated on the color page
- Colllor: color palette generator
- ColorClaim: created in 2012 by Tobias van Schneider with the goal to collect & combine unique colors for his future projects.
- ColorCombos: color inspiration
- ColorDot: color inspiration
- ColorDrop: color inspiration
- ColorHunt: a free and open platform for color inspiration with thousands of trendy hand-picked color palettes
- ColorLisa: Color palette masterpieces from the world’s greatest artists
- ColorMind: a color scheme generator that uses deep learning. It can learn color styles from photographs, movies, and popular art.
- Colors.lol: Overly descriptive color palettes
- ColorThief: Grab the color palette from an image using just Javascript.
Works in the browser and in Node. - ColorWise: search through the most voted products on ProductHunt
- ColorZilla: Quickly pick and copy the hex code for any color you see on a website
- ColourCode: color inspiration
- ColourLovers: a creative community where people from around the world create and share colors, palettes
and patterns, discuss the latest trends and explore colorful articles - ConstantContact Logo-Maker: logo-maker. Turn your passion into a brand – LogoMaker generates hundreds of options in seconds.
- CoolHue: color inspiration, with the plugin you can directly access gradient colors palette inside your favorite prototyping tools
- CoolText: text graphics & logo generator. Free service. Various categories.
- CraftWork: interface assets for designers and startup creatives. UX/UI (HTML templates, react templates, email templates, mobile UI kits, web UI kits, wireframe kits), illustrations (3D, constructions, raster, vector, custom), Graphics (icons, mockups, presentations, social), Store (accessories, hoodies, t-shirts), freebies
- CreateHerStock: Founder, Neosha Gardner, launched in July 2015. A grassroots resource, a go-to digital space for stock imagery that can be used for lifestyle, business, and even everyday content creation for bloggers, creatives, and online influencers of color
- CreativeFabrica: fonts, graphics, crafts, embroidery, tools, bundles, freebies
- CreativeLive: Master your craft, your passion, or something new with creative classes taught by the world’s best (photo &video, money & life, art & design, craft & maker, music & audio). Free live classes on-air every week. Overview.
- CreativeMarket: Photography, Web Design, Themes (marketplace). Overview.
- CreativeTacos: Ready to use 4000+ design assets from independent creative professionals.
- Creatopy: Ad design automation platform. Automation, animation, customization, brand alignment, ad serving, collaboration.
- CreepyFace: A Javascript library that makes your face look at the pointer. Ideal for resumes or team pages.
- Crello: Free graphic design tool to help you create impressive content in minutes. Browse thousands of professional templates and edit them right away.
- CSS Author: freebies, resources, CMS, coding, WordPress
- CSS Icon: open-source CSS isons
- CSS Spider: The quickest and convenient way to copy, visualize, edit and export CSS.
- CSS-Tricks: articles, videos, almanac, snippets, newsletter, jobs, guides
- CutOut 8 Pro: The Best Photo Cropping Software. With CutOut 8 Pro you can perfectly crop out image motifs, flawlessly position motifs in front of new backgrounds, or remove distracting objects with a single click. You can easily swap backgrounds and lend your portraits a completely new look, so realistic as if the photo was taken in front of the new background. It works like magic! This user-friendly software has now become budget-friendly too, though not for long. Grab this deal for just $29 for a limited time only.
SPONSORED
CLICKDESIGNS
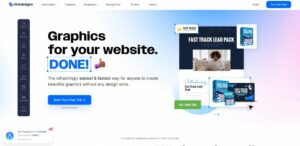
Graphics for Websites
Main Slogan: The refreshingly easiest & fastest way for anyone to create beautiful graphics without any design skills.
Features:
- AI Engineering: copywriter, image creator, social writer, background remover, object remover, face cutout, toonize, blur background, image enhancer, colour correction, photo library
- 20,000+ templates
- Premium Fonts
- Media assets
- Gradients
- Illustration library
- Advanced text style
- Icons librry
- Designer elements
- Vector doodles
- Patterns
- Image & photo filters
- 2D & 3D Layouts
- Brand kit
- Watermarks
- Layers panel
- Cloud storage
- Project folders
- QR code creator
- Built-in image sharing
- Real-time image editing & hosting
- API
Use Cases: marketers, bloggers, funnel designers, authors, publishers, eCommerce stores.
Templates: web pages, logos, boxshots, book covers, sales funnel graphics, device mockups, product bundles, product packaging, apparels, KDP publishing, thumbnails, social media, and so much more.
Other departments: help, tutorials, raving fans, demo.
About: 123 Click Limited. 128 City Road, London, EC1V 2NX. UK. 120 countries
SPONSORED
COOLORS
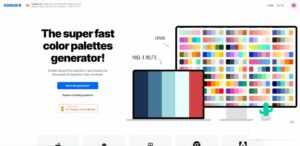
Colour Palette Generator
Main slogan: Create the perfect palette or get inspired by thousands of beautiful colour schemes.
Products:
- Browser, iOS, Android, Figma plugin, Chrome extension, Adobe extension
Features:
- Generator
- Explore popular designs
- Extract palette from image
- Contrast checker
- Preview palettes on design
- Recolour your own design
- Colour picker
- Free fonts
- List of colours
- Gradients
- Image converter
- Collage maker
- Font generator
Other departments: Jobs, license, help center, advertise.
About: Used by 5M+ designers and top companies. By Fabrizio Bianchi. Piazza R. Gaucci, 23, 00034, Rome, Italy.
SPONSORED ADVERTISEMENT

SITES
D
- DaButtonFactory: A free and simple button desigden tool that helps you create high-converting call-to-action (CTA) buttons for your website, blog pdesost, social media post, or email.
- DaFont: free fonts
- DanoDay: free stuff for radio and voice over pros
- DavinciResolve: The world’s only solution that combines professional 8K editing, color correction, visual effects and audio post production all in one software tool. Instantly move between editing, color, effects, and audio with a single click. he high performance playback engine makes editing and trimming incredibly fast, even for processor intensive formats such as H.264 and RAW. With over 250 built in tools, Fusion VFX’s advanced 3D compositing engine and node based workflow let you quickly connect effects and tools together in a flow chart style, making it easy to create cinematic feature film quality visual effects and broadcast motion graphics. About: by Blackmagic Design Pty. Ltd.
- DepositPhotos: Photos, vectors, editorial, music, videos. Overview.
- Descript: a collaborative audio/video editor that works like a doc. It includes transcription, a screen recorder, publishing, full multitrack editing, and some mind-bending useful AI tools
- Design.org: a private community to help you explore new ways of thinking to unleash your fierce, untapped creativity, and create happiness in your life.
- DesignBold: design is really simple. Expect epic and sophisticated results without any need for technical expertise!
- DesignerPics: FREE Hi-Res photos for your personal & commercial use. Attribution not required! By Jeshu John and CorporateDesigners
- DesignerUp: An ecosystem of product design resources to help you become a more mindful designer and create better products.
- DesignEvo: a free online logo maker with 10,000+ templates that anyone can use to bring to life a compelling, unique logo in minutes. Discover 10,000+ Professional Grade Logo Designs. Categories: gaming, cool text, football, food & drink, fashion & beauty, real estate, animal & pet, letter, monogram, 3D, and so much more. Millions of free vector icons. 100+ fonts in various styles. Color schemes: solid/gradient colors. High-quality SVG and PDF files. Font files used in logo designs. Copyright ownership. SPECIAL COUPON: 10% OFF Any Plan with CODE: DESIGNEVO10.
- DesignHill: World’s # 1 creative marketplace with professional designers and unique products created by independent artists. Overview.
- DesignModo: grow your business with website and email design tools – postcards: email newsletter template builder, slides: website builder for animated static webpages, startup: Simple Bootstrap Builder for Everyone. Create websites and landing pages online using the Startup Bootstrap builder. It’s a fast and easy way to start your business presence online, with the help of pre-designed blocks. Full review with video walkthrough and exclusive bonus
- DesignPickle: access to a professional designer ready to jump into your creative ecosystem
- Designs.ai: Create logos, videos, banners, mockups with A.I. in 2 minutes
- DesignShack: Established in 2003, a magazine for creatives, designers, and developers.
- DesignShock: design packs, icon sets, WordPress themes, printing templates, plugins
- DesignWizard: create impressive videos and image designs in minutes
- Desygner: join over 12 million people and 15 thousand businesses using Desygner. Design content such as social media posts, ads, presentations, business cards, flyers, and more. Review.
- DIY Book Covers: Book cover templates and free maker, 3D book mockups, custom design, book formatting. Tutorials, writing tips, blog, publishing. By Derek Murphy.
- DIY Graphic Designs: 2,000+ conversion-boosting graphic templates
- Dojo3D: An all-in-one library for 3D story telling, aimed at all ages of coder. No software installation required, useful for CoderDojo, Hour of Code activities etc.
- DrawingMadeEasy: how to draw people, hands, eyes, faces, and more with these easy video tutorials taught by a pro artist
- DreamyPixel: A duo of photographers, from Slovenia. These free images are licensed under a Creative Commons Attribution 4.0 International License. You need to attribute the artist DreamyPixel full review
- Dribbble: the leading destination to find and showcase creative work and home to the world’s best design professionals. Departments: job board, freelance projects
- DropMark: collect inspiration from around the web to create your own moodboards
- Dunnnk: epic mockups and freebies in your mailbox (iPhone, android, macbook, iPad, iMac, apple watch)
- DXO: photo editing app
SPONSORED
DEALJUMBO
Discounted Design Bundles with Extended License
Products:
- Fonts
- Mockups
- Graphics
- Photos & Textures
- Under $10
- On Sale
Other departments:
- Marketplace
- Freebies
- Partners
- Get Advertised
- Unlimited design downloads
About: 8 Mojmírova, Bratislava, 821 02, Slovakia.
SPONSORED
DEEEZY
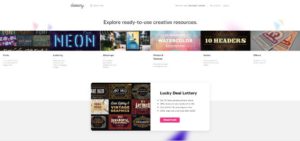
Ready-To-Use Design Resources
Products:
- Fonts
- Lettering
- Mockups
- Photos & Textures
- Vectors
- Misc
Other departments:
- Marketplace
- Freebies
- Featured Items
- Featured Authors
- Get Advertised
- Graphic Design Deals
About: 2,5M+ downloads.
SPONSORED
DESIGNCAP
Graphic Design Software
Main slogan: Speed up your creative process to make striking graphic designs for your business, event, social media, and more.
Categories:
- Marketing & Event: infographic, poster, invitation, business card, Facebook ad, logo, chart, flyer, card, brochure, menu, leaderboard, email header
- Document: presentation, resume, report, schedule
- Social Media Graphics: YouTube channel art, FB cover, Tumblr banner, FB post, Pinterest graphic, YouTube thumbnail, Twitter header, Instagram post and story
- Special Occasions: cards, invitations, birthday cards, wedding invitations
Features:
- Templates & Resources: countless options, 1000s of delicate designs, built-in fonts, shapes, backgrounds, large library of stock photos and icons
- Elegant visual charts
- Exclusive and well-grouped modules
- Save time and money, stand out from the crowd
- No skills needed
- Powerful tools
Other departments: support, tutorials, tips, FAQs, suggestions, learn, ideas and inspiration, press and media center.
About: PearlMountain has focused on the research and development of graphic design software since 2006.
SPONSORED ADVERTISEMENT

SITES
E
- Easil: drag-and-drop design tool that empowers your whole team to create visual content so good, it looks like a pro designed it.
- EditorX: build outstanding, fluid sites with flexible grids and full breaking point control
- EmptyEasel: a website for artists and art lovers (marketplace). Overview.
- EnvatoMarket: web design, photography, web development, themes, music, video, educational resources (marketplace) freebies every month Full review
- EpicPXLS: free & premium curated fonts, graphics, templates, mobile app designs & UI Kits.
- Europeana: Search, save and share art, books, films and music from thousands of cultural institutions.
- EveryPixel: Stock image search engine powered by AI. 51 paid and free stock image websites and allows users to search through a massive database of stock photos in seconds. Founder – Dmitry Shironosov. 28M+ vector images, 220M+ paid photos, 1,5M+ free photos, 29 paid stock image sites, 22 free stock image sites. EveryPixel Patterns: free collection. *Weekly freebies via email.
- Evil-Icons: Simple and clean SVG icon pack with the code to support Rails, Sprockets, Node.js, Gulp, Grunt and CDN.
- Excire Foto: Excire is an AI-based powerful photo management software for Windows and MacOS, designed for easy photo management and quick content-based browsing. Its numerous built-in smart features will help you to get organized and find the photos you are looking for in the blink of an eye!
- ExposureEmpire: premium lightroom preset packs and bundles
- Extempore: an app to replace expensive video equipment with your smartphone
- EyeDropper: an open-source extension that allows you to pick colors from web pages, color picker, and your personal color history.
SPONSORED
ENVATO ELEMENTS
WordPress, photos, graphics, add-ons, fonts, graphic templates, presentation templates, web templates, CMS templates, 3D
Envato is one of the leading marketplaces where thousands of creatives meet entrepreneurs, designers, developers, freelancers, and directors. Beyond the multimedia departments, there are educational sections that teach people how to create websites, videos, apps, graphics, and more. WordPress, photos, graphics, add-ons, fonts, graphic templates, presentation templates, web templates, CMS templates, 3D. Freebies every month
SPONSORED ADVERTISEMENT

SITES
F
- Facetime: a video calling application and very famous platform for apple inc. now it’s available on windows as well.
- FadeToBlack by Viddyoze: video creation secrets that turned a teenager into a millionaire *this is the training program that helped me create videos FadeToBlack full review
- FancyCrave: They say ” Fancycrave raises the bar of stock imagery by collaborating with independent photographers to deliver stunning, emotionally-driven photo packs fit for any project.
- Favicomatic: generates favicons, both .ico & .png (even transparent ones!), and the HTML code needed to make your website look awesome on every browser and every device. Free tool
- Favicon.io: favicon generator
- FaviconGenerator: This favicon creator tool allows you to make favicons for free for personal or commercial use. Our favicon generator code is constantly updated in order to keep up with the latest HTML5, CSS and JavaScript techniques.
- Feather: v4.24.1 simply beautiful open source icons
- Ffonts: free fonts
- FGdesigners: a small group of great designers and art directors sharing useful stuff for designers
- Figma: a vector graphics editor and prototyping tool which is primarily web-based, with additional offline features enabled by desktop applications for macOS and Windows.
- Filmstro: Adapt professional Soundtracks to your Video with the world’s first dynamic Music Library. Royalty-free music, FCP X & Premiere Pro plugins, app for keyframing music
- FinalCutProX: Editing, audio, motion graphics, delivery, Advanced color grading, HDR support, ProRes raw, New metal engine, 360 video editing and VR headset playback, Accelerated performance with metal, optimized for the all-new MacPro, Multi-cam, video noise reduction, motion and compressor, high-dynamic range, HDR on Pro display XDR
- Finda: Search through thousands of free CC0 stock photos. Browse by collection: action, aerial, bokeh, close up, curves, glare, landmarks, landscapes, laptop, and more. Or you can browse by source. A handy search engine
- Fiverr: find the perfect freelance services for your business (logo design, WordPress, voice over, video explainer, social media, graphics, design, digital marketing, writing and translation, video and animation, music and audio, programming and tech, business, lifestyle). Overview.
- FlatFile: The elegant import button for your web app. The drop-in data importer that implements in hours, not weeks. Give your users the import experience you always dreamed of, but never had time to build.
- FlatIcon: The largest database of free icons available in PNG, SVG, EPS, PSD and BASE 64 formats. Over 3M+ icons.
- FlatUIcolorPicker: color inspiration
- FlatUIcolors: 280 handpicked colors
- Flickr: Find your inspiration, join the community, home to tens of billions of photos and 2 million groups. The Flickr Commons department’s key goal is to share hidden treasures from the world’s public photography archives. Flickr Usage
- FlipSnack: Digital flipbook maker for stunning magazines. Create, share and embed online magazines, transforming your PDFs into online flipping books.
- FlipWebsitesNow: home-study course: how to flip websites for profit
- FontAwesome: vector icons and social logos, icon set and toolkit
- FontBundles: deals, freebies, regular, script, logo, foreign, symbols, designs
- Fontello: icon fonts generator
- FontFabric: A digital type foundry crafting retail fonts and custom typography.
- FontJoy: generate font combinations with deep learning
- FontsArena: curated typography with a focus on contemporary typography and high-quality free fonts
- FontSelf: the easiest way to make your own fonts. Fontself Maker is an extension for Illustrator and Photoshop CC to quickly turn any lettering into OpenType fonts.
- FontShop: fonts, foundries, designers, freebies
- FontsNinja: a Chrome extension that lets you hover over the text on your screen to instantly help you identify a font, its size, line spacing, letter-spacing, and even the color hex code.
- FontSpace: 120,000+ Free fonts. Free downloads of legally licensed fonts that are perfect for your design projects. Font generator, designers, stuff.
- FontSquirrel: Free fonts have met their match. We know how hard it is to find quality freeware that is licensed for commercial work. We’ve done the hard work, hand-selecting these typefaces and presenting them in an easy-to-use format.
- ForGraphic: high-quality PSD mockups
- Formito: create forms that feel like an app, svg favicon maker
- FotoFlexer: free online photo editor
- FotoJet: online tool to create quality graphic designs, photo collages, edit photos, and video editor (NEW). Overview.
- Fount: identify web fonts on any site
- Fre:ac: a free audio converter and CD ripper with support for various popular formats and encoders. It converts freely between MP3, M4A/AAC, FLAC, WMA…
- FreebiesBug: free hand-picked resources for web designers, developers, constantly updated (icons, mockups, UI kits, website templates, Sketch, fonts, code, photos, inspiration)
- FreebieSupply: The freshest design resources for Adobe XD, Figma, Sketch, Photoshop and Adobe Illustrator. Mockups, mobile design, UI kits, icons, websites, misc, brushes, actions, fonts, vectors, WP themes, google slides, keynote templates, powerpoint templates
- FreeDesignResources: fonts, mockups, templates, graphics, add-ons, UI kits. You can submit your own freebies.
- FreeFrontEnd: HTML & CSS examples, speed code, Javascript resources, free books
- FreeGoodiesForDesigners: Help us to continue delivering high-quality freebies. Donate any amount you think this project worth it.
- FreeHTML5: free & premium HTML5 bootstrap templates
- FreeIconShop: Download free vector icons for commercial use (SVG, Ai, PNG & PSD Formats).
- FreeJect: free designs (templates, graphics, videos, add-ons, gradients, effects)
- FreeLogoDesign: create a free logo in seconds
- FreeMusicArchive: free music and royalty-free music
- FreePhotos: A free featured photo every day. There are also premium photos and a photo editor application
- FreePik: free and premium design resources (vectors, photos, PSD, collections, icons, presentation templates). Categories: animals, banners, business, cartoon, design, graphics, human, illustration, map, nature, ornament, silhouettes, summer, textures, valentine, web, wedding, backfground, birthday, buttons, christmas, easter, halloween, icons, logo, templates, music, objects, ribbons, sports, templates, transport, water, signs, symbols.
- FreeSound: huge collaborative database of audio snippets, samples, recordings, and all sorts of bleeps, … released under Creative Commons licenses that allow their reuse
- FreeVector: free vector art
- FroKnowsPhoto: 6-hour guide to shooting video as fast as possible by a world-class photographer and videographer
- Funnelify: Marketing Funnel & Page Builder Which Totally Automates Your Traffic, Leads, Commissions & Sales.
- FuriousCamera: good photos taken with mobile phone, tips, starter guide.
SPONSORED
FOTOR
Online Photo Editor for Everyone
Main slogan: Our online photo editor offers everything you need to enhance and edit photos effortlessly. Experience simple photo editing online for free!
Features:
- Crop, resize, circle
- Shape image, text editor, add border
- Blur background, frames, change background
- Collage maker, merge images, flip image
- PNG maker, sharpen, unblur
- Photo to Sketch, photo to cartoon, upscaler
- Retouch, face editor, enlarger
- Overlay, effects, blur
- Batch photo editor, font generator, QR code generator
- and more
Create:
- Marketing: logo, flyer, poster, business card, resume, card, and more
- Social Media: YouTube thumbnail and cover, Instagram post, Facebook cover, Twitch cover, Twitter cover
- Events: Valentine’s, thanksgiving, Christmas, halloween
AI tools: generators (image, face, art, avatar, video), photo effect, background remover, object remover, video enhancer, video background remover.
Other departments: templates, blog, tutorials, help, press, partners, NGO, GoArt, NFT creator, image converter and compressor.
About: 500M users worldwide, 190 countries, 3M social media fans. Founded in 2009. Various awards.
SPONSORED ADVERTISEMENT

SITES
G
- GazePass: Passwordless multi-factor authentication for any website or mobile app using biometrics on any device or platform
- GegoCart: laravel, nuxt js, vue js – based multi-vendor shopping cart software.
- GeneratedPhotos: Enhance your creative works with photos generated completely by AI. Faces, humans, datasets, API, solutions, FAQ, press.
- Genially: Create stunning presentations, infographics, and more in just seconds
- GetIllustrations: Get massive illustration packs. They’re very close to releasing their website so until then you can grab “Ghost” a free illustration pack from what’s coming. Free for personal and commercial use
- GetUIcolors: color inspiration
- GFX-1: graphic designs, 3D Cover designs, 3D software box designs, CD/DVD label and box/case designs, membership card designs, option box designs, and more
- Gimp: GNU image manipulation program, free and open-source image editor
- GitHub: a development platform inspired by the way you work. From open-source to business, you can host and review code, manage projects, and build software alongside 50 million developers.
- Giphy: free GIFs and stickers. Categories: Studios, animals, action, anime, cartoons, emotions, food/drink, gaming, holidays, memes, clips. Stickers: Originals, trending, reactions, packs. Various apps. Blog, arts, developers, labs, FAQ, support, jobs, guidelines. 10B+ GIFs, 1B+ people. GIPHY, Inc.
- GlyphrStudio: a free, web-based font designer.
- GoFullPage: Full Page Screen Capture. Capture a screenshot of your current page in entirety and reliably—without requesting any extra permissions!
- GoLightStream: Go live in minutes, in your browser powered by the cloud.
- GoogleArtPalette: color inspiration
- GoogleDesign: A directory of essential design tools and resources to keep your projects moving forward. Design, develop, tools, gallery, icons, fonts, people, AI guidebook, actions, design sprint kit, cardboard, wear OS, firebase, angular material, polymer paper elements, android auto, android TV, augmented reality design.
- GoogleFonts: free fonts
- GooglePhotos: edit photos, create slideshows, create albums
- GospelKeysEasy: Overnight Transformation – The Ultimate Piano Course for Beginner/Intermediate Gospel Musician
- GraphBerry: Free pixel perfect resources, made with love. Free for personal & commercial use
- Graphery SVG: SVG wrapper library
- GraphicBurger: Tasty design resources made with care for each pixel
Free for both personal & commercial use. Have a bite! - GraphicDesignFreebies: fonts, illustrations, mockups, templates, web design, exclusive freebies
- GraphicsFuel: search over 25M graphics
- GraphicSprings: Logo Creator. It’s a super simple solution for business owners, startups, online companies and beyond
- GridLayoutShock: responsive WordPress grid layout plugin
- GuitarCoaching: the fast, easy, and effective way to learn guitar (express guitar)
- GuitarControl: by Claude Johnson playing and teaching guitar for over 25 years and helped over 4.3 million guitarists with his guitar control newsletter. Improve your playing quickly
- GuitarLessonLounge: courses for beginners
- GuitarNotesMaster: software fretboard tutor will help you rapidly develop your guitar playing skills.
- GuitarSuccessSystem: learn to play guitar from your home with a proven and easy system that works
- GuitarTheoryRevolution: music secrets by a London based musician and guitar teacher
SPONSORED ADVERTISEMENT
SITES
H
- HandBrake: an open-source, GPL-licensed, multiplatform, multithreaded video transcoder.
- HarpnGuitar: online learning membership (harmonica and guitar)
- Hatchful: Create stunning logos in seconds
- HelloColor: color inspiration
- HeroPatterns: A collection of free repeatable SVG background patterns for you to use on your web projects by Steve Schoger, a UI designer and illustrator from Kitchener, Ontario
- HipsterLogoGenerator: logo generator
- HitPaw: AI-powered multimedia suite. Photo enhancer, video enhancer, video translator, and more.
- HobbyIntoBusiness: a course to help you create and sell your art by Nolan
- HowToDrawAnimals: online course and membership
- HowToDrawAnimalsUsingTheLutzMethod: by Richard Hargreaves
- HowToDrawCars: learn how to draw amazing cars in less than 30 minutes
- HowToWriteSongsThatSell: online video course with pdf and mp3 downloads
- HTML5up: makes spiffy HTML5 site templates that are fully responsive, built on intelligent HTML5 + CSS3, customizable, 100% free under the creative commons
- HTMLcolors: color palettes, inspiration
SPONSORED ADVERTISEMENT
SITES
I
- IcoFont: 2100+ free icons to spice up your creative designs
- IcoMoon: pixel-perfect icon solutions
- IconJar: A better way to manage icons. Keep your icons in one place, just a click away. IconJar leaves digging through your design resources folders behind so you can use icons without hassle
- IconMonstr: Discover 4496+ free icons in 313 collections.
- Icono: Pure css icons, with only one element
- IconShock: 2 Million+ professional icons library, Over 400+ icon sets in more than 30 styles
- IconStore: Free icons by first-class designers.
- Icony: free and awesome pixel perfect icons set.
- Illustrio:
- ImgPro: photo editing app
- Infogram: Create engaging infographics and reports in minutes
- InkScape: A professional vector graphics editor for Windows, Mac OS X and Linux. It’s free and open source.
- InSense: videos, music, design, arts (marketplace). Overview.
- InstantPiano: learn the secrets of piano is just 16 weeks by Cherry Hill academy
- InvisibleLineEditor: a free tool to create an invisible line in a text with just a click
- IonicFramework: One codebase. Any platform. Now in Vue. Over 100 mobile UI Vue components. Standard Vue tooling based on Vue 3. Target iOS / Android / Electron / PWA
- IonIcons: Premium designed icons for use in web, iOS, Android, and desktop apps. Support for SVG and web font. Completely open-source, MIT licensed and built by the Ionic Framework team.
- Ionos: domains, websites & stores, hosting, WordPress, marketing, email and office, servers, enterprise cloud, favicon generator
- iPiccy: edit photos, make collages, create designs.
SPONSORED
ICON FINDER
Icons – Design Assets Library
Products:
- Icons: 6M+ items. Feather, leto, pastel, font awesome regular and solid, system basic, ionicons sharp, iconoir, bootstrap, fluent regular and solid, phosphor (duotone, regular, fill, light), plumicons, and so much more.
- Illustrations: essential, pop, B&W activities, line people, purrity, Tuesday, zooloostrations, block, stories, calma, humanic, downtown, and so much more.
- 3D: metaverse, diversa, cubicle, mockupy, avatars, colorfull, picka, alter, and so much more.
- Stickers: project status, summer holiday, everyday communication, comic colored, cafe and restaurant, hearts, pop art, and so much more.
Other departments: designers, free icons, API, education, help, knowledgebase, service status, what’s new, request a quote, network, coupon code, become a contributor.
About: Copenhagen-based, Denmark.
SPONSORED
ICONS8
Icons – Illustrations – Photos – Music – Design Tools – AI
Products:
- Icons: PNG, SVG, Pichon (free app), Plugins (drag and drop), Iconizer (edit SVG), Animated, Line Awesome, Emoji, Windows 11 colour, Glyph Neue, iOS Glyph
- Illustrations: Dribble, Mega Creator (drag and drop library), Animated, Threedio (3D models for motion design), 3D, Universal, Trendy, Education, Business
- AI: Face Generator, AI-generated photos, Anonymizer (protect identity), Face Swapper, Generated Humans, Datasets, Generated photos API, Smart Upscaler API, Background remover API
- Photos: Background Remover, Moose (studio stock), transparent PNG, PBR textures
- Music: action, adventure, background, battle, business, cartoons, city, comedy, commercial, and so much more. Genres, playlists, sell your music, favourites
- Lunacy: free design software that keeps your flow with AI tools and built-in graphics. Documentation, requests, releases, features, backlog.
Other departments: Blog, forum, advertising, API, Omg-Img, FAQ, help, licenses.
About: A team of 40 designers, developers, and artists who don’t resell products, they create them.
SPONSORED
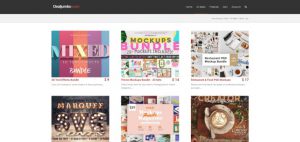
INKYDEALS

High-Quality Graphic Design Deals for Creative Professionals
Deals:
- Graphics: icons, illustrations, objects, textures, patterns, backgrounds, t-shirts. Software: photoshop, lightroom, illustrator, affinity.
- Templates: social media, resume, flyers, branding, logo, UI kit, mockup, HTML, presentation, infographics.
- Fonts: display, sans serif, serif, script.
- Add-ons: brushes, presets, actions, effects, overlays.
- Tools: photo editor, video editor, stock photo.
- Bundles
Other departments: Support, FAQ, license, past deals, submit a deal, blog, coupons, freebies.
About: Launched in 2011. They partner with designers to get the best deals and design bundles, at exclusive prices.
SPONSORED
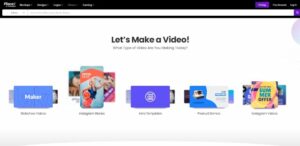
INVIDEO
Video Production Suite
Departments:
- AI: YouTube video editor, slideshow maker, talking avatar, script generator, text to video, video editor, video generator, faceless video generator, voice generator
- Studio: intro & outro maker, video ads, birthday videos, Instagram, invitations
- Templates: business, YouTube, slideshow, intro, outro, ads, real estate, social media, and much more
- Business presentation, Invites and wishes, offers and discounts
- Video collages, webinar promos, quote videos
- Video testimonials, product video ads, long-form ads
- Branding templates, bite-size ads, covid-19
- Greetings, listicles
- Quick tools: rotate, trim, cut, video compressor, converter, screen recorder
Other departments and resources: blog, shows, tutorials (various topics), FAQ, jobs, live chat, Facebook community, schedule a demo, creator’s club.
About: 98% happy customers, 1,8M+ videos created, 100K users, 150+ countries, 51-200 employees. San Francisco, California. Privately Held. Founded in 2017.
SPONSORED ADVERTISEMENT
SITES
J
- Jam.dev: collaboratively improve your website
- JamIcons: free web icons
- JimBruceGuitar: from Texas to the delta blues guitar course
- JotForm: Easy-to-use online form builder for every business OVERVIEW
- jQuerySliderShock: responsive jQuery/WordPress slider
- JustInMind: All-in-one prototyping tool for web and mobile apps, From wireframes to highly interactive prototypes
SPONSORED ADVERTISEMENT
SITES
K
- KeyShot: The fastest, easiest to use 3D rendering and animation software for both Windows and Mac.
SPONSORED ADVERTISEMENT
SITES
L
- Landr: create, master, and sell your music. 3M+ members.
- LeadPages: sales funnels, automation, landing pages, and more. LeadPages – sales funnel builder overview. Confidently grow your business by turning clicks into customers with high-converting landing pages you can easily DIY. Powerful features you’ll only find at Leadpages. LeadPages landing pages overview
- Learn from Fiverr: Online professional courses, led by the world’s top experts (marketing, graphic design, web, writing, business, video and photography, programs)
- LearnHeavyMetalGuitar: heavy metal chords and scales to play 90% of metal songs in under 31 days
- LearningToPlayTheGuitar: an absolute beginner’s guide by Anthony Pell
- LearnUX: Learn user-first design with practical skills and tools
- LightroomPresets by Laura Zambelli: The best professional Lightroom presets you can find online, now all in one package! Created by professional photographers
- Line25: built in March 2009 as a place to share web design ideas and inspiration through articles, tutorials and examples of stunning site designs
- LittleVisuals: Free, high-resolution images. Use them any way you want – free for commercial use. Little Visuals began life as a passion project of Nic Jackson. Tragically, Nic died suddenly in November 2013. Whilst Nic didn’t get the chance to maintain and grow Little Visuals himself, this website remains accessible to all. As his family, we have ensured that all of the images will remain available and free for commercial use.
- Lobe: train machine learning models with a free, easy to use tool.
- Logaster: Brand Maker! Part of Incomedia.
- LogoGenie: Design a perfect logo in under five minutes. Choose from over 1000 premium logo templates
- LolColors: Curated color palette inspiration by WebDesignRankings
- LoremPixel: placeholder images for every case
- LostType: Operated and Managed by Riley Cran (and originally co-founded with Tyler Galpin), Lost Type is the first of its kind, a Pay-What-You-Want type foundry. Since 2011 Lost Type has been a source for unique typefaces, with a collection of over 50 different faces from contributors all over the world.
- LovingEditingWithPhotoshop: professional photoshop tutorials
- LowPolygonArt: a huge collection of free low polygon graphics and backgrounds
- LS.graphics: Big library of isometric devices mockups. Realistic and clay versions, UI/UX tools, scene creators, illustrations, free mockups and tools. Categories: UI/UX tools, devices mockups, branding mockups, scene creators, illustrations, free mockups and tools. They also own LS.Graphics Charts – the most comprehensive collection of charts, graphs, and diagrams for Sketch (featured on Product Hunt).
- LucidPress: You need on-brand, personalized content that gets results. Lucidpress’s brand templating solution empowers everyone to do just that, all through lockable brand templates.
- LukaszAdam: Free SVG illustrations (commercial and personal use) under the CC0 license (MIT license) — No attribution required.
- LunaPic: editor photos, open images from various sites and apps, post images on social media, convert file formats, add animation, free product
Logaster Logo Maker Overview
SPONSORED ADVERTISEMENT
SITES
M
- M-Operator: a repository of minimalist royalty-free audio pieces (CC license)
- MagicMockups: free real-life product/app mockup generator, No copyright, no attribution needed, Free for any non-commercial or commercial use. You can donate
- MagicPattern: create awesome patterns for your clients – unlimited unique background patterns generated by a single click. Perfect for branding landing pages, social media posts and social share images.
- MakeaMarimba: build your own marimbas, xylophones, and vibraphones
- MakeYourMovieNow: how to write, produce, and sell your film
- Markably: an elegant rich text editor with full markdown support.
Built for blog posts, webpages, technical documentation, or to simply keep some notes. - MasterBundles: graphics (icons, illustrations, patterns, logos, badges, textures, backgrounds, t-shirts, characters, infographics), fonts (san serif, serif, script, display, symbol), add-ons (photoshop plugins, illustrator add-ons, lightroom add-ons, procreate brushes), templates (presentations, social media, mockups, printable, resume, UI kits, certificates, magazines, landings, WordPressd), stock content (footage, photo, vector images). Free items. Download 5 free presentation templates here.
- MaterialDesign: a design system – backed by open-source code – that helps teams build high-quality digital experiences
- MaterialDesignIcons: a growing icon collection allows designers and developers to download icons in the format, color, and size they need for any project.
- MaterialPalette: color inspiration
- MaterialUI: color inspiration
- MaterialUIcolors: color inspiration
- MitchMartinez: a collection of selected imagery, visuals, cinematography, free super hD footage
- MJML: The only framework that makes responsive email easy
- Mockerie: Mockup Your Website Or App. Interactive, Instant and on FREE Stock Photography.MockupWorld
- MockPlus: all-in-one product design platform for prototyping, collaboration, and design systems
- MockupsJar: Createe mockups for your website, mobile apps, and more in 3 simple steps. No Photoshop or plugins needed. Various categories. 919+ mockups.
- MockupWorld: free mockups, deals, coupons. iPhone, iPad, MacBook, iMac, Apple Watch, Packaging, Billboards & Signs, Fashion & Apparel, Food & Beverages, Magazines & Books and more!
- Moni’s Photo: Photography tips and tricks.
- Moveast: This is a journey of a Portuguese guy moving that decided that every photo should be used for free. Help yourselves and use them wherever you want (CC0)
- MusicForMakers: royalty-free music for your podcasts, videos, and more
- MusicMan: AI powered software – auto-compose original & unique premium music tracks in seconds. Use as background music in videos, unlimited downloads, millions of combinations
- MusicScores: online sheet music prepared for your instrument or ensemble
- MusicWithEase: read ledger line notes
- MusicWithEase: read music notes for children
- MusicWithEase: read music notes for adults
- Muzli2: Why open up a boring new Chrome tab when you can start with a beautiful board that gives you your daily dose of design inspiration and news?
- MyFonts: the largest selection of professional fonts for any project. Over 130,000 available fonts. Freebies.
SPONSORED
MOVAVI
Video Suite
Main slogan: A powerful video-editing software bundle that includes a video editor, file converter, screen recorder, and other goodies to turn you into a true content guru.
Products:
- Video: video suite, editor, slideshow maker, business, converter, clips
- Screen recording
- Photo editor: picverse, slideshow maker
- For education
Features:
- AI magic: motion tracking, background removal, slow motion.
- Edit like a wizard
- Effects
- Colour correction, transitions, intros, stabilisation, audio editing, titles, filters and LUTs, stickers, free music and sounds
- Cut, crop, trim, rotate, resize, reverse, chroma key, improve sound quality, overlay
Other departments: help center, how-tos, knowledge base, learning portal, blog.
About: Founded in 2004. 200+ countries, 3M+ happy users. Various awards. USA, Cyprus, UAE.
SPONSORED ADVERTISEMENT

SITES
N
- NameCheap logo maker: a very easy-to-use app to create logos, business cards, and other media in an instant. Infinite combinations, fully customizable. Overview
- NiceVeryNice: Design resources featured by our curators
- NicheSiteTemplates: mini-site templates to improve your online image
- Nimbus: screenshots and screen video recorder
- NoCopyrightSounds: music without limitations, YouTube channel
- Nodes: your thinking space for exploring ideas with code. Compose, abstract, generalise. Start from top down or bottom up and refine as you go. With Nodes, programming feels like sketching on a canvas. Zoom in and out of problems, experiment on the side and easily re-use parts of other projects.
- NomadPictures: free stock photos
NameCheap Logo Maker Overview
SITES
O
- OBS Studio: Open Broadcaster Software is a free and open-source cross-platform streaming and recording program built with Qt and maintained by the OBS Project. As of 2016, the software is now referred to as OBS Studio. There are versions of OBS Studio available for Microsoft Windows, macOS, and Linux distributions.
- Octave: A free library of UI sounds, handmade for iOS
- OctIcons: a set of icons
- OilPaintingMasterSeries: learn how to paint with oils
- OmniGeometry: Designer software, recursive technology, export vector files, organic interface, animation, and more
- On1: professional photo editing
- OnePageLove: one-page websites, templates, and resources
- OnlineLogoMaker: A handy app to create your own logos. 2M+ brands used it. Uncomplicated interface, large font selection, countless logo templates, save your project and edit later. Blog, tutorials, support. Free & paid. Overview.
- OpenColor: open-source color scheme. Optimized for UI like font, background, border, etc.
- Open-Foundry: curated and open-source fonts. A free platform for curated open-source typefaces.
- OpenShot: an award-winning free and open-source video editor for Linux, Mac, and Windows. Create videos with exciting video effects, titles, audio tracks, and more. Cross-platform, trim & slice, animation & keyframes, unlimited tracks, video effects, audio waveforms, title editor, 3D animations, slow motion and time effects, video editing, 70+ languages, simple UI.
- Over: Create professional ads, branded content, and stunning stories in minutes. Now available on desktop and mobile by GoDaddy
- Overflow: Create interactive user flow diagrams that tell a story.
OnlineLogoMaker Video Overview

SITES
P
- Pablo: create beautiful images easily to make your posts pop by Buffer
- Paint: edit photos, create designs
- PaintingWithPastels: by Emma Ralph
- PaintShopPro: Take your underwater and drone photography to new heights with the Sea-to-Sky™ workspace and level up your photo editing workflow with smarter tools powered by AI by Corel
- Palettable: Generate beautiful color palettes using the knowledge of millions of designers.
- PaletteGenerator: Find design inspiration with natural image palletes extracted using k-means algorithm. This palette generator will create a color palette based on the predominant colors in your image. You can use it in your art projects, web design or home decor.
- Paletton: color palettes, HTML web design, UI design
- Palettr: Generate fresh, new color palettes inspired by a theme or a place.
- PaperForm: Over 6,000 businesses use Paperform to create beautiful forms, automate workflows and save time.
- PCDJ: Mix everything, Live performance DJ software, video mixing software, karaoke software
- PencilDrawingMadeEasy: learn to draw like a master artist, over 42 hours of easy-to-follow training videos.
- Pepsized: Design freebies (icons, Sketch, Photoshop, textures, UI design, vectors) and tutorials (CSS, HTML, illustrator, Javascript).
- PhosphorIcons: a flexible icon family for interfaces, diagrams, presentations. You can donate. It’s free and open-source.
- PhotoAdKing: easy to use. Free graphic design templates. Free downloads & HQ outputs. Stock images and fonts created by professional designers
- PhotoEditor: free online photo editor
- PhotographyMasterclass: master any DSLR camera and take gorgeous, attention-grabbing photos by following step-by-step video tutorials
- PhotoLemur: edit photos, create collages, design projects, create logos, print projects
- PhotoMirage: Professional-looking photo animations in minutes, gallery, tutorials, support Overview
- PhotoPea: free online photo editor
- PhotoPosPro: edit photos, make collages. Version 3 has free and premium photo editing features offering users a wide variety of possibilities
- PhotoScape: edit photos, make collages, create GIFs
- PhotoStack: an open-source batch photo editor that runs entirely on the web, complete with watermarking support and compatibility with all major browsers
- PhotoVibrance: photo animation, Transform ordinary images into moving masterpieces, Motion pictures get people’s attention, Turn regular product shots into engaging video ads, effects, extended capabilities & setting. EARLY-BIRD Lifetime huge discount June 07 Overview
- PianoByChords: piano courses and eBooks (pop, ballads, rock, blues)
- PianoForAll: Now Anyone Can Learn Piano or Keyboard. Join over a quarter of a MILLION Happy Students Worldwide
- PicJumbo: Download free and premium stock photos, backgrounds and free high-resolution images for personal and commercial use. Abstract, animals, architecture, backgrounds, business, fantasy, fashion, food & drink, holidays, love, nature, people, roads, snow & winter, sunlight, technology, objects, transportation, vertical. 9M+ downloads. High-quality and very interesting images by Victor Hanacek.
- PicSum: Easy to use, stylish placeholders. Just add your desired image size (width & height) after our URL, and you’ll get a random image
- PictureDesk: featuring art projects and illustrators behind them
- Pigment: color inspiration by ShapeFactory
- PikToChart: Quickly turn any text- or data-heavy content into a stunning report, presentation, infographic, social media graphic, or printable.
- PinnacleStudio: Products: Pinnacle Studio Standard, Ultimate, Ultimate Bundle, Dazzle DVD recorder, MultiCam capture. Resources: learning center, tutorials, user guides.
- Pinterest: image-driven social platform
- Pixeden: premium design & web resources (print, web, themes, icons, vectors, graphics)
- Pixel77: Graphic design inspiration and freebies. Design, tutorials, resources, interviews, fress off the press, contests, designer’s break, marketing, motivation.
- PixelBuddha: a creative team passionate about bringing the best
free and premium resources to the design community - PixelPerfectCutouts: 500+ HD Cutout People Photos For Your Projects, PLUS 72 Animated Powerpoint Slides That Turn Photos Into Videos
- PixelSurplus: top-selling font bundles, freebies
- Pixelz: effortless image editing
- Pixlr: free online photo editor
- PixoBlaster: Add spokesperson intros into your videos
- PixtaStock: photos, illustrations, footage, free images and videos (marketplace). Overview.
- Pizap: photo editor, collage maker, design tool (free and premium)
- PlaceholderPics: The lightest way to include placeholder pictures in your designs. All images are lovingly served up as sub-kilobyte, fully optimized Scalable Vector Graphics (SVG) in any size or color you need. You can even add a short label to keep track of what goes where in your designs and mockups.
- PlaceIMG: easy FPO and dummy images for any project
- Placemat: Some pretty nice placeholder nouns for your site (people, places, and things), powered by imgix. Simple and flexible. Made with love by Paul Straw.
- Plasfy: the Easiest Graphic Designing Tool. An all-in-one easy-to-use online software that allows you to create professional graphics and designs for your business in just a few minutes.
- Platform.uno: Pixel-Perfect Multi-Platform Applications with C# and WinUI, The first and only UI Platform for single-codebase applications for Windows, WebAssembly, iOS, macOS, Android and Linux
- PlayPopularMusic: by Betty Wagner, music teacher, eBook
- PlayWorshipGuitar: learn guitar and popular worship songs with a step-by-step guide in just 30 days
- PlotaVerseApps: PlotaVerse – creative network. PlotaGraph: original “patented” photo animation app, PlotaMorph: the one of a kind multi morph software, PlotaFX: the ultimate FX collection, PlotaShop: coming soon, Marketplace: coming soon Overview
- pngTree: png imaes, backgrounds, templates, text effects, illustrations, freebies
- PokePalettes: color inspiration
- Polarr: photo editor (free and premium)
- PollsAPI: a powerful API to add polls to your website or application. Thier secure cloud based API scales with your needs.
- Pond5: videos, music, photography, web design (marketplace). Overview.
- PortraitPro: fast and easy portrait editing software
- PresentationPanda: an eBook to help you create slides by Adam Noar
- ProducerNetwork: voice packs and samples
- ProducersPiano101: discover the secret 99% of producers will never know about playing piano
- ProductHunt: Product Hunt surfaces the best new products, every day. It’s a place for product-loving enthusiasts to share and geek out about the latest mobile apps, websites, hardware projects, and tech creations. Departments: deals, jobs, radio, makers, toolkit.
- ProjectClarity: UX guidelines, HTML/CSS framework, and Angular components working together to craft exceptional experiences
- PropelStocks: world’s largest cloud-based 1-click searchable platform with more than 50M+ royalty-free stock images, videos, GIFs, animations, memes, and audio tracks.
- ProRapAcademy: How To Freestyle Rap Better Than Kendrick Lamar
- Purple-Planet: FREE 192kbps MP3 Download – FOR YOUR OWN PROJECTS (you have to attribute the artist) or you can purchase HQ WAVs with commercial license
SPONSORED
PIXTELLER
Easy-to-Use Online Image Editor & Animation Maker
Main slogan: Bring life to your idea and use pre-designed graphic templates to turn words, photos and illustrations into marvelous images and animated videos in minutes.
Categories:
- Graphic images
- Logos
- Slideshows
- Banners
- YouTube thumbnails
- Posters
- Animated logos
- Quotes
- Flyers
- Wallpapers
- Cards
- Video story
- Collages
- Invitations
- Animated GIFs
Features:
- Photo editor
- Animation maker
- PixBot – automatically creates image & animated video templates
- 100,000 templates
- 5,000 animations
- 1,5M photos
- 100,000 shapes
- Gradient colors
- Animation timeline
- Inspiring features
Templates:
- Social media
- Cards
- Posters
- Animated posts
- Full HD video
- Animations
- Marketing
- Events
- Banner designs
- Covers & headers
- Animated ads
- Custom visuals
Other departments: blog, video tutorials, write for us.
About: Alexandru Roznovat, founder and CEO, Florentin Cristinel, senior PHP developer and CTO. 11-50 employees. Bucharest, Sector 1. Sole Proprietorship. Founded in 2014.
SPONSORED
PLACEIT
Digital Marketplace
Departments:
- Mockups
- Designs
- Logos
- Videos
- Gaming
- Templates
- Background remover
- Image and video cropper
Other departments:
- Mockups and mockup generator
- Design templates and online design maker
- Logo templates and logo maker
- Video templates and video maker
- Gaming templates
- Free video to gif converter
- Free online video cropper
- Free image cropper
- Free Covid-19 templates
- Templates and resources for business
- Blog
- RecordIt
- License
- Careers
Resources: blog, careers, learning center.
About: part of the Envato family.
Logo Maker With Templates – Review
Logo templates categories:
- Freebies
- Abstract, Animated logos, Architects, arts & crafts
- Avatars, bakeries, bars/pubs, beauty, catering
- Chiropractic, cleaning services, clothing brand
- Coffee shops, consulting, contractors
- Daycare, dentists, doctors, electricians
- Event planners, finance, fitness, free image cropper
- Gaming teams, landscaping, hip hop
- Law firms, HVAC, maintenance company
- Mechanics, moving companies, musicians
- Organic products, painters, pet shops
- Pharmacists, photographers, psychologists
- Realtors, restaurants, sports teams, teachers
- Tech companies, travel agencies, wellness
- Writers/publishers, YouTubers
SPONSORED
PRODUCTIONCRATE
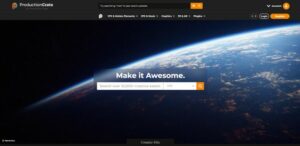
A Powerful Library of Digital Assets
Departments:
- VFX & Motion Elements
- Visual effects: magic powers, muzzle flashes, toon/anime FX, explosions, fire & sparks, vehicles, Sci-Fi, Debris, extras, action & horror, liquids/ace, natural elements, animals/creatures, plants & flowers, VFX training
- Mograph & Editing: transitions, typography kits, backgrounds, elements/accents, buttons & icons, technology, lower thirds, lens flares/bokeh, fluid colour, YouTube, textures & overlay filters, holiday, medical, sports, hand gestures, aerial, After Effects
- SFX & Music
- Sound Effects: electricity, fighting, lock and load, weapons, gun-related, explosions & bangs, crashes/debris, and so much more
- Sound Design: noir/classic, bass drops, cinematic hits, epic sounds, anticipation, horror, funny sounds, and so much more
- Royalty-Free Music: thriller, suspense, drama, fantasy, western, Sci-Fi, feel good, funny, epic, and so much more
- Graphics
- Still Effects: building damage, bullet holes, cracks, Scorch Marks, lens and glass, blood splatter, torn fabric
- Film & Video: aspect ratio bars, cobos, compositional grids
- Textures: puddle maps, grunge surfaces, roads
- Set Extensions: explosions & smoke, buildings, landscapes, clouds, space, and so much more
- 3D & AR
- Models: urban, weapons, vehicles, money & treasure, space, ancient, sports, and so much more
- Materials: architecture, terrain, rock, and so much more
- Environments: skies, studio, aerial, ocean, and so much more
- Plugins & Extensions: LaForge, SoundsCrate, LightWrap, Godrays, Hologram Generator, Crate’s Toolbox, and so much more
- Stock Images
- Scripts & Plugins
- Tutorials
- VR & HDR Environments
- VFX Contests
- News
- Help
- Media Kit
- FAQ
SITES
Q
- QodeInteractive: [SPONSORED] premium WordPress themes in various categories (creative, business, online store, wellness, lifestyle, food & restaurants, blog & magazine, entertainment, technology, travel, education, wedding, listing, real estate). Magazine (design, tutorials, resources), marketing blog. Qode stories (case studies). Qode Lab (catalog, kaleidoscope).
- Quarkly: Design tool for creating websites and web apps.
- QuotesCover: A fully-featured quote maker that has tons of beautiful fonts, graphics, or photo background inside an intuitive online quote maker web app.
- QwikBanners: web banners. Get your display network campaign going in few clicks, generate multiple sizes in seconds, no coding or design skills required.
SITES
R
- RawPixel: All-in-one creative design platform. Free stuff, topics, designs, elements, remix, mockups, art, public domain, premium, spotlight.
- RCPtones: a collection of basic and beautiful UI sounds has every sound your app needs. Includes 600+ royalty-free tones professionally mastered for mobile
- React-spring visualizer: The missing visualizer for your react-spring UI animations
- RealFaviconGenerator: Check your existing favicon with our online tool and see what can be improved.
- RecordIt: fast screencasts with GIF & Twitter support (by PlaceIt)
- RedDesertViolin: learn to play violin and fiddle
- ReDub: Speak to the world! Dub your content into 70+ languages at a click of a button, and reach millions of new fans.
- RemakeTheWeb: turn your design into a working web app in 30 minutes, an open-source framework for making web apps with just HTML and CSS
- Reshot: Free Icons & Illustrations. Design freely with instant downloads and commercial licenses.
- ReviveSocial: WordPress plugins for social media marketers
- ReVoicely: Create high-quality translated videos in any language within minutes.
- Ribbet: photo editing, effects, collage maker, grids, text, stickers, fonts, 2.7M free stock photos, templates. Plenty of options. Community, blog, mobile apps.
- RightFontApp: an innovative, beautiful and professional font manager app for Mac, helping designers preview, install, sync and manage their font files.
- RocketPiano: free lessons, step-by-step instructions, tutorials, jam tracks, and famous songs to learn piano. Over 90,000 people used it.
- RocketUkulele: a complete step-by-step guide to learning ukulele in 30 days
- RockGuitarMastery: master thousands of your favorite songs in 60 days
- Rooki.design: online magazine for students, interns and juniors with intimate interviews, free design student awards and free resources
- RoundIcons: 42,000 icons. The world’s biggest icons bundle. Commercial use icon packs library made for apps, websites, infographics, and prints
SPONSORED
RELAYTHAT

On-Brand Design Automation App
Main slogan: Turn any team into a marketing army and instantly convert brand guidelines into consistent, high-performing images. Small efforts = BIG presence!
Solutions:
- Enterprise
- Real Estate
- Entrepreneurs
Features:
- Brand management: Manage and switch between multiple workspaces and campaigns in a single click
- Headline generator: Karate chop writer’s block in no time with wildcard keywords that automatically generate the perfect copy!
- Defeat “creative block”: Access curated libraries of the top-performing color and font combinations that professional marketers use
- One-click resize: Resize and remix layouts to perfectly fit any advertising or social media channel with no additional tweaking needed
- Unify your brand assets: Automatically create a consistent look for your brand without even trying. The more you use it the better it gets
- Over 3 million free images: Enjoy access to 3 million royalty-free images with no usage fees or additional costs
Other departments: help center, FB group, reviews.
About: 2-10 employees. Boston, MA 02116, US. Sole Proprietorship. Shaun Farr: Chief revenue officer, Michal Sikora: full stack developer.
SPONSORED
RENDEROSITY
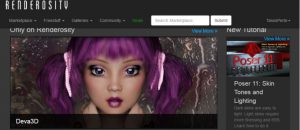
Established Digital Marketplace
Main slogan: A very interactive community with forums, chats, free content and a marketplace for digital products and 3D models!
Departments:
- Music
- Poser software
- Prime flash sales
- 2D & 3D Models
- Figure essentials
- Services
- Merchant resources
- Lights or cameras
- Games and apps
- Software
- Tutorials
- Licenses
- Marketplace
- Free stuff
- Galleries
- Community
- News
- Deals
- Memorials
About: An online art community since December 1998.
SPONSORED
RIVERSIDE
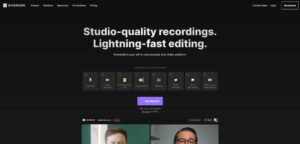
All-In-One Podcast and Video Platform
Main slogan: Studio-quality recordings, lightning-fast editing.
Products:
- Recording: record separate, high-quality video and audio tracks
- Editing: fast and easy powered by AI
- Transcribing: accurate transcriptions in 100+ languages.
- Magic Clips: create bite-size, shareable social clips using AI
- Mobile app
Features:
- Captions
- AI show notes
- Teleprompter
- Media board
- Async recording
Solutions: podcasters, producers, marketers, high-performing teams.
Use cases: podcasts, learning & development, internal communications, webinars, customer testimonials, virtual conferences, l;ive show, split-screen video.
Resources: University, blog, webinars, help, case studies, community, partners, masterclass, recorded on.
Other departments: careers, FAQ, for business, podcast maker, recorder, live podcast, YouTube video maker, screen recorder, video compressor, wav to mp3, podcast name generator, YouTube name generator, mic test, webcam test, and more.
About: Founded in 2020 by two brothers Gideon and Nadav. Originally from Amsterdam, now headquartered in Tel-Aviv.
SITES
S
- ScatterJar: Delicious free food photographs for creatives. No attribution is required.
- SecretGuitarTeacher: online guitar courses, structured learning and guidance from an experienced guitarist
- SimpleIcons: 1463 Free SVG icons for popular brands
- Singorama: Melanie Alexander Learn To Sing From A Top Vocal Coach And Ex #1 Pop Singer That Has A Platinum Album And 2 Gold Albums
- StePalette: Copy the entire color palette from a website and import the swatches into Sketch, Adobe, Google or Coolors.
- SiteOly: turn your Google Sheets data into a website without writing code
- SitePoint: a hub for web developers to share their passion for building incredible Internet things. Founded by Mark Harbottle and Matt Mickiewicz in 1999, SitePoint is for web professionals, by web professionals: developers, designers, programmers, product creators and entrepreneurs alike. Books, courses (Javascript, HTML, CSS, PHP, design & UX, mobile, WordPress, workflow)
- Sketch: a vector graphics editor for macOS developed by the Dutch company Sketch B.V.
- SketchAppSources: 4250 Sketch resources. UI kits, icons, wireframes, web, wearable, iOS, material, data, forms mockups, real
- SketchRepo: Sketch App resources: desktop, mockups, icons, misc, plugins, mobile, UI kits, websites
- SkillShare: explore your creativity with classes in illustration, photography, design, and more. Join over 8 million creators around the world. Overview.
- SkyCons: a set of ten animated weather glyphs, procedurally generated by JavaScript using the HTML5 canvas tag.
- SlideShare: Share what you know and love through presentations, infographics, documents and more.
- SmartIcons: Customizable SVG icon system for the modern web. Various categories.
- SmartMockups: the #1 product mockup generator (free and premium mockups)
- SmartShow3D: Create animated slideshows with photos, videos, and music, Experiment with 600+ professional templates & effects, Add voice comments, captions, title clips, and even 3D collages!, Make your slideshow sound amazing with 200+ music tracks, Convert photo movies to any video format or burn to DVD, Stylish slide transitions, Sensational animation effects Overview
- SmashingMagazine: practical articles for web designers and developers
- Society6: Hundreds of thousands of artists from around the globe, uploading and selling their original works as 30+ premium consumer goods. Departments: wall art, home decor, pillows & bedding, bath, tech, stickers & stationery, apparel, tabletop, bags, featured.
- SocratesTheme: build beautiful, fast-loading niche blogs, landing pages, and membership sites
- SoundBible: free sound clips for download in either wav or mp3 format. We offer free and royalty-free sound effects and clips for video editors, movie scores, game designers, and weekend sound warriors
- Spectrum: see through the eyes of those that experience different types of color vision deficiencies
- Spline: Easily create 3D web experiences without coding. Build and iterate fast with production-ready results.
- SprayPaintArtSecrets: comprehensive video tutorials cover everything from basic to advanced spray paint art skills.
- StartaPhotographyBusiness: how to attract photography customers
- StartaWebDesignBusiness: attract clients like a magnet, get paid top dollar on every job, make more money than your competitors
- StartBootstrap: bootstrap themes, templates, and more to help you start your next project. Free and open source
- Stencil: Create beautiful social media graphics on the fly
- Stockocity 2: Royalty-free premium FHD video backgrounds & footage.
- StockPhotosForFree: free stock photos
- StoryBlocks: Stock media library. Video, audio, images, collections, footage, creative tools, series. Blog, careers, become a contributor, API, maker for teams, FAQ, help. Founder: Joel Holland.
- StreamLineIcons: Search, download, and copy 30,000 vector icons with our App. Work faster with our plugins for Figma and Sketch. Download 30,000 free PNG icons.
- StringTheoryChords: All Common Guitar and Piano Chords at Your Fingertips
- Stripo: create professional and responsive email templates fast without any HTML skills. Overview
- SVG Backgrounds: Customize and apply backgrounds fast. SVGs enable full-screen hi-res visuals with a file-size near 5KB and
are well-supported by all modern browsers. What’s not to love? An amazing free tool with attribution - SVG Export: grab the SVG version of a logo or image from a website
- Swatches: colors for every purpose
- SystemFlow: Custom Design System for your business. Order an individually crafted design system to boost your brand’s consistency and efficiency. Marketplace, Studio, Circa, Blank, Curated.
SPONSORED
SNAPPA
Create Online Graphics in a Snap
Main slogan: Whip up graphics for social media, ads, blogs, and more—even if you’re not a graphic designer.
Features:
- Perfect image dimensions
- Pre-made templates
- Free hi-res stock photos inside
- Text, graphics, and effects in seconds
- Remove image backgrounds with just one click
- Resize best graphics in a flash
- Schedule and share
- Add text to photo
- Images: blur, cropper, flipper, resizer, rotator, photo editor, speech bubbles
Use Cases: banners, eBook covers, social media, image quotes, infographics, profile pictures, SoundCloud, Twitch, banners, thumbnails, panels, headers, and so much more.
Other departments: Knowledgebase, for teams, brand assets, compare, blog, help.
About: 25M+ images created. Founded in 2015 by Christopher Gimmer and Marc Chouinard.
SPONSORED
SOUNDOP
Professional Audio Workstation for Seamless Productions
Features:
- Waveform and spectral editing
- Multitrack recording and mixing
- Burning audio tracks to CD
- Batch processing audio files
- VST3 effect plugins
- ASIO and WASAPI devices
- Automating audio effect parameters
- Editing metadata across formats
- Intuitive and flexible workspaces
- High DPI display
File formats: .wav, .aif, aiff, mp3, FLAC, ogg, wma.
View, record, edit, and manipulate audio in multiple ways, including customizable waveform, spectral and multitrack views.
About: By Ivosight Software Inc.
SITES
T
- Tabbs.pro: navigate chrome tabs like a pro
- TailorBrands: logo-maker
- TasteMinty: Hire skilled illustrators globally and get generated contract with license for each collaboration
- TechSmith: Visual creation tools. Communicate effectively with screen, voice, and webcam recording and editing. Products: Snagit (screen capture, image editor), Camtasia (screen recorder, video editor), Audiate (Instant Transcription and Text-Based Voice Audio Editor), Screencast (Content Hosting, Organization, Team Collaboration, and Unlimited Sharing), Knowmia (Interactive and Accessible Video Learning Platform), VideoReview (Collaborative Feedback Tool Designed for your Video Projects). Various resources, assets, libraries, and training. About: Founded in 1987, billions of images and videos by 65M people in 222 countries.
- TempestVision: tools for the iOS developer. PSD to Xcode (convert PSD designs/mockups to a runnable Xcode project in minutes), muneris (speed up your development workflow)
- Templated: a collection of 867 simple CSS, HTML5, and responsive site templates released for free under the creative commons
- Textures4Photoshop: hq textures for free
- TheBritishLibrary: free photos
- TheDesignEst: design freebies, inspiration, videos, tutorials, toolbox, featured, tech, wallpapers
- TheHungryJpeg: design bundles, add-ons, crafters, fonts, graphics, templates, freebies
- TheLeagueOfMoveableType: an open-source font foundry. Courses and memberships to help you level up your skills.
- TheLibraryOfCongress: free photos
- ThemeIsle: WordPress themes, plugins, a set of free icons., and so much more. Overview.
- ThemeMatcher: converts your existing website into an optimized custom WordPress theme
- ThemeShock: premium WordPress themes, freebies, and plugins
- Themezy: free website templates and WordPress themes, you can become a contributor
- TheMockupClub: get the best design mockups for free. Various categories. They own The UI Kit Club. Olivier Heitz.
- TheMotionMonkey: over 300 free retro arcade video game sound effects pack
- TheNounProject: icons and photos for everything
- ThePatternLibrary: a project by Tim Holman and Claudio Guglieri compiles patterns shared by the most talented designers for you to use freely in your designs. You can share your own patterns
- TheUIkitClub: best free UI kits. By Olivier Heitz
- ThriveCart: cart pages, one-click sales funnels, affiliate campaigns, tracking
- ThumbnailBlaster: Attention-Grabbing Thumbnails In 3 Clicks with the world’s only AI thumbnail creation app for YouTube, FB, Instagram, or any other video platform.
- TinEye: image recognition and search capabilities
- TinyHelpers: A collection of free single-purpose online tools for web developers
- ToIcon: One late summer day in Amsterdam, we were working on a project for a 3D printing client. We were struggling with a series of metaphors – how could we illustrate verbs like to level or to extrude or to preheat or to slice? Furthermore, what metaphors effectively communicate these verbs to engineers operating laser sintering machines? The idea for to [icon] was born.
- Tookapic: Perfect photo project for beginners. Take and share one photo a day for a whole year. You will create an unforgettable record of your life and learn to take better photos along the way
- Topol: Beautiful emails, made easy. Use drag & drop to create emails in minutes. No coding or design skills needed. Overview
- TrickPhotographyBook: create mind-blowing artistic images with top secret photography tutorials.
- TTSmp3: Free text-to-speech and text-to-mp3 for US English.
- TTS sketch maker: Whiteboard Sketch videos with text-to-speech human-sounding voices in minutes
- Tuxpi: 60 photo editing tools
- Tyle: Free Photo Slideshow Video Maker
- TypefaceApp: a wonderful font manager for macOS that helps you pick the perfect type for your designs
- Tyrus: A free digital toolkit from Airbnb Design that helps freelance illustrators optimize their business, so they have more time to focus on what they love.
SPONSORED
TEMPLATEMONSTER
Website templates, WordPress themes, presentations, graphics, plugins, 3D, video, audio, infographics, services
Slogan: a large and growing marketplace where you can find high-quality digital products matching the latest web standards.
About: Simplifying design processes since 2002. TemplateMonster was established with a simple idea: all web PROs should get high-quality digital products with ease.
1,001-5,000 employees. Public Company. Miami, US. Dmytro Kuriksha, CEO.
Owned by Theme Technologies LLC. Operated by Jetimpex Inc.
Statistics: 5M+ clients, 1,640+ authors, 60,000+ digital products, 2M+ monthly visitors.
You can sell your own products.
There are additional benefits for authors/sellers.
Premium quality, free website designs, niche-specific projects, all kinds of businesses, a multitude of industries, affordable prices.
Blog, services, help center, academy, service center, coupons, certification, courses, tutorials, forum/community.
Flagship product – MonsterONE subscription (unlimited downloads, lifetime access)
SITES
U
- Ucraft: logo-maker, landing page creator, designer tools, web hosting, online stores, media, eCommerce, integrations
- UIcoach: UI design challenge generator (project ideas, color palettes, font pairings, illustration libraires)
- UIcloud: The largest user interface design database in the world.
- UkuleleBuddy: Ukulele lessons for beginners, the only 100% video-based method that enables you to play your favorite songs by strumming along with three 7-minute videos per week by JP Allen teaching and performing music professionally for over two decades
- UltimateAcousticBluesGuitarCourse: by Jimmy Dillon, a San Fransisco pro guitarist
- UnDraw: Open-source illustrations for any idea you can imagine and create. A constantly updated design project with beautiful SVG images that you can use completely free and without attribution.
- UnLayer: Use drag & drop to create emails in minutes. No coding or design skills needed Email template builder overview
- UXdesign: Curated stories on user experience, usability, and product design
- UXplanet: One-stop resource for everything related to user experience
- UXtoast: Learn the fundamentals of UX & UI Design, including design laws and principles, visual design, and design processes.
SITES
V
- Vecteezy: high-quality vector graphics for personal and commercial use, you can become a contributor. Professional quality creative resources to get your projects done faster. Photos, vectors, videos, bundles, motion graphics. Millions of free resources, simple licensing, fresh content, options for any budget. Community of creators.
- VectorStock: the world’s Premier Vector-only Image Marketplace
- Vectr: a free graphics software used to create vector graphics easily and intuitively. It’s a simple yet powerful web and desktop cross-platform tool to bring your designs into reality.
- Veed.me: video production marketplace, from Fiverr
- Vegas (Creative Software): Video production & editing. VegasPro: The fastest NLE. Multiple nested timelines, industry-leading HDR editing tools, and an easy-to-use, yet powerful color grading workflow. Other products: SmartScription, Expansion packs, Movie Studio. Discover: Learn, tutorials, artists. Support: forum, tools, downloads. Business Solutions (audio & video production). Bundles. About: 2003, MAGIX Software GmbH.
- Venngage: make infographics that people love
- VideoConverterFactory: 4K (UHD), 1080P (FHD), 720P (HD), 480P(SD) Conversion Full Control, 300+ Formats and Devices Supported.
- VideoDashboard: Discover growth trends, Build unlimited platform-specific videos, Schedule and syndicate your videos to all platforms from 1 unified app
- VideoDyno: 3-in-1 video sales app writes flawless ads & video sales script, creates videos & brings buyers to your funnels and websites
- VideoFlow: full-stack video platform for media companies. Manage and stream video, create interactive video experiences and custom OTT channels, all with zero code
- VideoProcConverter: The VideoProc converter comes with a range of tools and functions that can help users cut, trim, merge, resize, convert, flip, and adjust video and audio files. You can use VideoProc to add subtitles, watermarks, and effects, and also balance shaky clips. This tool is empowered with Full Hardware Acceleration and Full GPU acceleration that gives this software high speed, without compromising the quality. Aside from recording and altering, VideoProc also works as a tool that you can use to record online content like music and videos and download them on your PC. You can save every one of the recordings in a variety of formats including DVD, MP4, HEVC, DGI, AVI, MOV, ISO, WMP, and HDR, among others.
- VideoProducerPro: Video producer software, animated intro video maker, animated title video maker, micro-video editor, animated outro, screen recorder, image & video merger, YouTube downloader & uploader
- VideoSurgeon: jumpstart your guitar playing by 614% by using what the pros use
- Videezy: free 4k stock footage, after effects templates, vectors, brushes. You can become a contributor
- VidJar: world’s first, ultra-fast, video-hosting & marketing platform. Training videos, trending videos from YouTube
- Vidlery: Unleash your creative potential with our in-depth comparisons, roundups, reviews, and tutorials on video editing, photo editing, and design software.
- VidsPlay: Completely FREE Stock Footage. You are granted non-exclusive rights to use and download our video material without the need to pay royalties for each use
- Vimeo: Make, manage, and share videos. OVERVIEW
- VirtualPose: the ultimate visual reference series for drawing the human figure
- Visme: Design and share beautiful on-brand presentations, infographics, and any other visual communications for you and your team
- VisualHunt: visual search engine for products, photos and ideas. Algorithms, experts, community, get advertised.
- VisualReel: Create cinemagraphs, memes & quote-pics automatically
- VocalWebinar: learn to blow your audience away with these live secret online classes
SITES
W
- WebDesignDev: freebies, website templates, WordPress themes and plugins, Photoshop, Illustrator, DreamWeaver tutorials, reviews, inspiration, web development, CSS, roundups, programming
- WebDesignerDepot: web design community, freebies
- WebDesignRankings: Find the perfect web design partner
- Web.dev: Get the web’s modern capabilities on your own sites and apps with useful guidance and analysis from web.dev.
- WebFlow: Build better business websites, faster. Without coding.
- WebFXcolorpicker: a free HTML color selector
- WebGraphics360: 450 meg ultimate web graphics package
- WebiBazaar: [SPONSORED] Leading Themes and Development Company in India. Themes & Templates like OpenCart, PrestaShop, BigCommerce, Shopify, WooCommerce and various categories. You can sell your own templates in their store and create your own store purchasing website templates as well with their modules and premium services.
- WebmasterDeals: stock photos, textures, overlays, Illustrator, Photoshop, vectors, icons, and more
- WebSelf: create your own free website, simple design, professional look, website, mobile, SEO, domain, support
- WeDistill: Curated HD Video Free For Your Personal and Commercial Use. 10 free HD videos every 10 days. You can submit your own videos. Marketplace (buy and sell)
- WeLoveIconFonts: a free & open source icon fonts hosting service.
- WhatFunk: all music published on whatfunk can be used for commercial and noncommercial purposes at no cost
you do not need to ask permission from or provide credit to whatfunk, although it is appreciated when possible
if you want to support this project, feel free to donate - WindowResizer: select the screen size you want to see and automatically resizes your browser window
- Woobro: free vector images for commercial use. SVG, Sketch, AI, PNG.
- WordMark: enter a word or phrase to preview with fonts on your computer
- WPforms: Drag & Drop WordPress Form Builder, Join 3,000,000+ Professionals Who Build Smarter Forms and Surveys
- WP Theme Generator: Create and personalize your own WordPress Themes.
SPONSORED
WONDERSHARE
Video Suite
Main slogan: We empower digital creators with software
solutions tailored to their imagination.
Products Categories:
- Video Creativity – Filmora (intuitive video editing), DemoCreator (efficient tutorial video maker), UniConverter (high-speed media conversion), Virbo (powerful AI video generator), Presentory (AI video presentation maker), Creative Center (all the creative tools in one place), DemoAir (screen recording add-on for Google Chrome), DVD Creator (make your own DVDs), Filmstock (a massive library of royalty-free video effects, photos, clips, and more), Anireel (Easy way to create riveting animated explainer videos), AniSmall (Your powerful video compressor without losing quality), Ani3D ()Convert from 2D to 3D videos, from good to great, PixStudio (An easy online graphic maker for content creators), PixCut (A one-click background remover to enhance your photo editing workflow).
- Diagram & Graphics: EdrawMax (simple diagramming), EdrawMind (collaborative mind mapping), EdrawProj (a professional gantt chart tool), Mockitt (design, prototype, and collaborate online).
- PDF solutions: PDFelement (PDF creation and editing), Document Cloud (cloud-based document management, PDF Reader (simple and free PDF reading), HiPDF (free all-in-one PDF tool).
- Data Management: Recoverit (lost file recovery), Repairit (repair broken videos, photos, etc.), Dr.Fone (mobile device management), MobileTrans (phone to phone transfer), FamiSafe (parental control app).
- Business: productivity solution for enterprise.
Other departments: education, partners, resources, shop, newsroom, global presence, careers, video community, support.
About: 1,200 employees in 6 offices worldwide. Tobee Wu, Founder and CEO. Wondershare Technology Inc. Launched in 2003.
SITES
X
- X Stock Video: free stock footage. Free to download and free to use in a ‘Free to view video project’ (promotional, event, educational, client, youtube without ads). If you want to use the footage for commercial purposes (a film or television production, commercial app, game, youtube with adds or other software) you can buy an extended license for a small fee.
SITES
Y
- YayImages: 13.5M royalty-free stock photos, vectors, and videos. Sourced directly from 18,000 photographeyrs from over 145+ countries. Plenty of categories, very affordable membership plans. Special lifetime membership option.
- Yessy: paintings, prints, photography, and more (marketplace). Overview.
- YouZign: join 100K people that growing their businesses with the most powerful yet simple all-in-one free visual marketing solution
SITES
Z
- ZippyPixels: Bundles, mockups, print, graphics, web, mobile, freebies. A collection of fellow web and graphic designers who love creating high-quality resources at affordable prices.
- Zola: Your one-stop static site engine. Forget dependencies. Everything you need in one binary.
- ZondIcons: A set of free premium SVG icons for you to use on your digital products
- Zurb: a team of designers, researchers and nerds that help companies design better products, websites and services by using user data.
FREE STOCK PHOTOS
OVERVIEW
This list contains sites that offer free stock photos that can be used for any purpose, both for personal and commercial projects. The majority of these images are used under the CC0 1.0 Creative Commons Universal public domain dedication without any attribution, but there are exceptions. So please read the terms on each site before you download the images.
Restrictions
Have in mind, that you can’t sell or redistribute free photos as they are or as prints. You can’t add these images to other stock photo sites, replicate a similar or
How photography copyright laws affect what you share online
The article by PikWizard about “Photography Copyright” explains everything in detail regarding images you find online. How you can use them, what problems might occur, anything you need to know is there.
- 1MillionFreePicptures: A repository of thousands of 100% free pictures! No registrations, no fees. By Toper and Kinkin. Various Categories.
- AvoPix: All images and videos on Avopix are released free of copyrights under Creative Commons CpC0 (public domain). Stock photos, videos, vector images. 155K+ free photos, 188M+ premium photos, 9M+ videos, 12K+ daily visitors.
- BarnImages: Free hi-res photos for everyone. Launched in March 2015 by Igor Trepeshchenok and Roman Drits, 2 photographers from Latvia. Over 2,000 photos.na
- BucketListly: Free travel photos. A free creative commons (Attribution-NonCommercial) collection of over 7000+ travel photos from all over the world anyone can use.
- CC0.photo: Public domain photos. A project initiated by Raffael Herrmann with the help of his uncle Peter Janzen. You can buy the artist a coffee.
- CreativeCommons: Use this prototype to find images that you can use and remix across several open archives. Filter by: use, titles, creator, tags, collections. Over 1.1 billion digital works available under CC licenses. 9M+ items.
- CupCake: Free original images to use as you want – CC0. The owner, Jonas Wimmerström (former Nilsson Lee) runs a premium external store as well. You can browse the images but they are not categorized.
- DeathToTheStockPhoto: Allie and David offer free monthly photos for your creative needs every month via email and premium packages you can find on the site. Go premium and get access to 2,000+ images and 7+ video packs you can’t find anywhere else + more every month.
- DesignersPics: Free hi-res photos for personal and commercial use. No attribution required. Various categories.
- FocaStock: Free photos, videos, and templates. Use them in your website, themes, templates, projects, print materials, social posts, and more. CC0 license. Overview.
- FoodiesFeed: They say ” They laugh at us in restaurants”. More than 900 photos – CC0. 2.8M+ views, 1.1M+ downloads, 102K+ views per month. Founder: Jakub. You can submit your own photos.
- FreeDigitalPhotos: Download free and premium stock photos and illustrations. High-quality, produced by a community of professional stock photographers and digital illustrators. People, food & drink, metaphors and symbols, sports and leisure, business, government and public services, bature, transportation, energy and environment, health and beauty, objects, travel, architecture, holidays and events, science and technology, backgrounds. Every image is free with no restrictions, with an option to buy larger images at reasonable prices. Operated by AgileBit Limited. There’s a handy advanced search function.
- FreeFoodPhotos: Delicious food photography. A banquet of great looking food photos set free with creative commons. You need to attribute the artist.
- FreelyPhotos: Free religious photos to help small churches and ministries.
- FreeNatureStock: Royalty-free CC0 Nature Stock Photos, Videos, & Vectors. Use them however you want. Created by Adrian Pelletier. Updated daily. Another Tumblr blog. They recently added videos. Overview.
- FreeRangeStock: Great photos, totally free – all images are licensed under Equalicense. You can submit your own photos.
- FreeStocks: Free stock photos – CC0. Categories: animals, city & architecture, fashion, food & drink, nature, objects & technology, people. Over 1000 images.
- Glyphs: free stock photos, icons, docs.
- GoodFreePhotos: A large Public Domain photo repository with high-resolution free photos and vectors. All copyright free stock photos and royalty-free photos, and CC0 Photos. 24900 free and public domain photos, images, clipart, pics and vectors and counting. You can submit your own photos.
- Gratisography: Quirky, creative, always free photos. No copyright restrictions. Estimated total number of images 700. Whimsical, animals, people, urban, nature, business. Founded and created by Ryan McGuire.
- ISO Republic: Thousands of High-Resolution CC0 Licensed Images for Your Next Creative Project. Over 3,000 photos. They own FoodieFactor, a new website dedicated to free food and drink stock photos (over 1,200 photos). You can submit your own photos.
- Iwaria: Free African high-quality photos.
- JayMantri: Free pics. Do anything (CC0). Make magic. Jay divides images in chronological order beginning from March 2014. This is, in essence, a Tumblr blog. Jay is also active on Instagram.
- Jeshoots: new and unique free stock photos and PSD mockups in hi-res – CC0. Created by Jan Vasek in 2014.
- KaboomPics: Free stock photos, mockups, articles. 8,000+ images, 890+ photo shoots, 8M+ downloads, 6M+ user visits. There’s a handy advanced search function. Created by Karolina – a coffee addict who spends her time creating digital images. She’s a photographer, graphic designer, and a website creator.
- LibreShot: Free fine art photography. Free images for blogs or websites even for commercial use. No need to mention the author. By Martin Vorel. There’s an option to buy prints (framed print, canvas print, art print, acrylic print, metal print or wood print) from the artist in higher quality.
- LibreStock: They scan and index the best free photos from the top stock sites so that you can find that perfect image much, much quicker. 6,000+ CC0-licensed photos. Another handy search engine.
- LifeOfPix: Free hi-res photography. Give life to your pix. There’s also an advanced search function. Departments: featured, gallery, photographers, free videos. They honour a photographer per week with 10 images. You can create your own portfolio, personalize your photos, and follow your favorite photographers.
- Magdeleine: a free hi-res photo every day. Categories: nature, city, architecture, peopel, animals, food, technology, objects, abstract. CC0 images – public domain, attribution required.
- MorgueFile: free images for creatives, by creatives. Over 350,000 free stock photos for commercial use. You can submit your own photos.
- MotionElements: it includes free stock photos (5 items per week). Overview.
- MoveEast: Free CC0 photos.
- MyStockPhotos: 1,300+ unique and free stock images. People, architecture, animals, flowers, landscape. nature, objects, and much more. CC0 license.
- Nappy: Beautiful photos of black and brown people, for free. CC0 license. You can submit your own art.
- NegativeSpace: free stock photos for personal or commercial use, CC0 license. Categories: Abstract, animals, architecture, art & design, business, city, fashion, food, landscapes, music, nature, objects, people, seasonal, space, sport, technology, transport, travel, typography, virtual backgrounds.
- NewOldStock: vintage photos from the public archives. Free of known copyright restrictions, recapturing history.
- Pexels: free stock photos & videos shared by talented creators. You can submit your own photos. Discover, popular searches, classification, trials, videos, wallpapers, collections, challenges, FAQ, become a hero, partners, API, apps & plugins, leaderboard, blog, license. Founded in 2014. Overview.
- PhotoStockEditor: free stock photos for commercial use. New photos every week. Various categories.
- Picalls: images, pictures, wallpapers. Free images without copyright restrictions. Trending, landscape, flowers, black and white, people, food & drink, and much more.
- Picography: High-resolution, royalty-free, free stock photos. Free license. Various categories. Popular searches: business, people, technology, scenery.
- PikWizard: HQ, free stock photos., templates, and videos Abstract, aesthetic, autumn, baby, backgrounds, and much more. Commercial license.
- PixaBay: Stunning free images & royalty-free stock. Over 1.600322 million+ high-quality stock images and videos, illustrations, and vectors shared by their talented community. You can submit your own artwork. Overview.
- Pixta: Overview.
- PublicDomainArchive: New 100% free stock photos, every single week – CC0. There’s also a premium section where you get to download all the free images in bulk plus you get exclusive access to extra packs of hi-res photos every month. 400K+ downloads.
- RealisticShots: Free stock photos (high resolution) for personal and commercial use. 7 new photos every week. Just make something creative!
- RovenImages: Beautiful free images. Editor’s choice, abstract, animal, architecture, decoration, and much more. Read the license. See also: RovenLogos, RovenThemes. RovenThemes Overview.
- ShotStash: free stock photos for creative professionals. People, wallpapers, business, beautiful, office, computer, and more. CC0 license.
- Shutteroo: Free images, no worries.
- SkitterPhoto: a place to find, show and share public domain photos. CC0 license.
- Skuawk: free stock photos and sounds for a stress-free atmosphere. Sport, space, food, business, back to school, shapes & architecture, music & sound, landscapes, urban, technology, people, objects, wildlife, nature.
- Slon: Free stock photos and illustrations.
- SplashBase: free, hi-res photos and videos. Learning resources.
- SplitShire: Instant download private collection of free stock photos, free stock videos & high resolution images for personal and commercial use. Various categories.
- StartupStockPhotos: free stock photos, CC0.
- Stockified: Free photos to do whatever you want – CC0. By Kiran BV.
- StockSnap: free from copyright restrictions CC0 stock photos. Various categories. You can submit your own. A wide range of categories. Collections (virtual backgrounds, mobile wallpapers, autumn foliage.
- StockUp: over 25,000 free stock photos.
- StockVault: Free stock photos, textures, and illustrations added daily. Popular: nature, business, flower, abstract, wallpapers, food, and more.
- StreetWill: free vintage photos to use any way you want – CC0.
- TitaniaFoto: Free image database. CCo license. Nature, animals, landscape, city, food, drink, and more.
- TravelCoffeeBook: Sharing beautiful travel moments. All photos are listed under cc0. That means you can do whatever you want with them.
- Unsplash: free stock photos, various categories (3D renders, animals, architecture & interiors, experimental, fashion & beauty, film, nature, people, sports, travel), collections. Explore, advertise, Unsplash+.
- Vladimir’s Collection: free photography by Vladimir Kudinov. CC0 license.
FREE STOCK VIDEOS
- BeachFront B-Roll: One of the best places to download (for free!) unique HD stock video footage and animated backgrounds for any production purpose. All clips in the library are completely free to use and are a simple “right click save” to download. This work is licensed under a Creative Commons Attribution 3.0 Unported License.
- ClipCanvas: Footage, backgrounds, after effects, free clips, blog. There are around 175 free stock videos you can download by registering a free account.
- Coverr: Beautiful free stock video footage. Categories: business, nature, people, fitness, lifestyle, aerial, love, food, drink, animals, travel, and so much more. About: Founded in 2015, Coverr offers a catalog of thousands of free, high-quality videos that have been downloaded more than 5 million times and are viewed 1.1 million times each month. You can submit your own footage.
- CuteStockFootage: Completely free stock video footage, VFX, light leaks, overlays, backgrounds, sound effects, photos, and textures. Various categories.
- FocaStock: see above.
- FreeNatureStock: see above.
- LifeOfVids: free videos, clips, and loops.
- LittleCloudCinema: free stock videos
- Mazwai: Stunning free stock footage clips, hand-picked by our in-house team of video professionals. Simple licensing, and no sign-up required. Marketplace (buy and sell).
- MixKit: completely free HD video, audio, illustration, premiere pro templates and art for you to use anywhere.
- MotionElements: it includes free stock videos. Overview.
- Pexels: free photos and videos. See above.
- Pixabay: see above.
- Pixta: Overview.
- SplitShire: see above.
VIDEO MARKETING
- AgencyReel: Groundbreaking “Self-Fulfilling” AI-Based App Builds and Runs a Professional Agency Business FOR You.
- AIVideoCreator: Create unlimited $1000 videos in 60 sec. video software with 1500 preloaded templates (niches, animations, voices), royalty-free, PC & Mac.
- Animaytor: Animvation video maker. Prem-made templates, on demand, automated video generator, kinetic animation effects, text2speechFX technology, animate transitionFX, 1-click voicesyncFX, dual timeline editor.
- BLUEFX: A suite of products: Free and premium after effects templates, Bundles, tutorials, academy, Explainer videos in powerpoint and keynote, Animated videos in powerpoint, The Kinetic2 template, Logo animation templates. About: Since 2008, their After Effects templates have been used by over 7952 customers.
- ClipDramatizer: Dramatize any video and skyrocket your results with the ultimate robotic AI tech. Animated and static effects, music tracks, full HD background videos, transparent video overlays.
- ClipGraph: create amazing cinemagraphics in 3 simple steps, video marketing software.
- ClipsReel: Complete auto-video creation and traffic, Unlimited video creation. VidURL creation technology, video customisation, 40K+ assets/images, 5,000+ background and abstract video clips, 650 background music files, 1,000 professionally selected fonts. About: VineaSX Solutions LLC – UAE.
- Cliptasia: AI-powered, cloud-based, drag-and-drop software that makes it easy peasy for you to create videos in minutes — no experience required! Highly engaging videos with the ability to add fonts, styles, backgrounds, effects, and music that result in professional and awesome videos that are quick and fun to make. You get an agency production studio for the ultimate video solution.
- ClipToGif: Animated GIF’s. It allows you to create GIFs from video or set of images, and add text, image, animated flash sticker, effect, and pan & zoom to it. You can make a GIF in black & white, flip it, play in reverse, and even bounce animation playback back and forth instead of loop. On top of that ClipToGIF gives you an ability to render both traditional animated GIF format to use on any image social media, and HD video format, to use on social media with looping video support like Facebook. 30-days money-back guarantee. About: by Explaindio.
- DoodleOze: Groundbreaking App Which makes Blackboard, Whiteboard, Greenboard & Even Glassboard Doodle Videos In Minutes! About: by Andrew Darius.
- EngagBot: video quotes automation software.
- EverWebinar: Webonars Platform. Create pre-recorded webinars that look and feel live. Flexible scheduling. Set dynamic “Just-In-Time” webinars that start within minutes upon registration. Live to Evergreen in one click. OVERVIEW
- Explaindio: 3D Objects Converter Business Edition (3D models, animations, and millions of paid ones), Profit Club (VIP access to the Profit Club library of over 20,000 doodle images, 4,000 background videos, AND 5000 animated scenes). ExplaindioElements: video creation app.
- GraphySuite: 300+ premium high-quality DFY graphics and video templates.
- GreenScreenActors: Make your videos look like Pro TV commercials by using real actors to sell your products
- LiveStorm: a simple meeting and webinar platform with built‑in tools, to grow and collaborate.
- MotionBox: Simple collaborative video editing software. Explore thousands of beautiful free templates. With the Motionbox drag and drop editor, you can customize your video for any occasion in just a few clicks.
- Motvio: Leverage futuristic video marketing technology to host, play, and market your videos.
- PowToon: Create jaw-dropping videos and presentations. Videos, whiteboard doodling, animated videos, screen recordings, custom characters. 113M+ powtoons created.
- RiseWithForce (TeknikForce): Software for internet marketing. Products: DFY Suite ClickAgency, VSL Maker, Swypio, Speedii, MemberzConnect, WP Story Machine, BotEngage, Retarget, WP Profitent, Envidio, Vid Popups, Interactrevolution, ClipDramatizer, EZSalaryZ, VidInc, Cliptasia, Ubiquitii, Funnel Base.
- SalesCopyMaker: Generate high-impact sales scripts for your sales videos, explainer videos, and social ads videos in minutes by simply swiping done for you templates and filling in the blanks
- ScriptReel: Create multilingual subtitles and voice overs for your videos automatically.
- SimpleStudioVideos: How to create awesome videos with the least equipment.
- Skype: A telecommunications application that specializes in providing video chat and voice calls between computers, tablets, mobile devices, the Xbox One console, and smartwatches over the Internet. Skype also provides instant messaging services. Users may transmit text, video, audio and images. Part of Microsoft.
- SocioWide: Video & graphic templates to create social media marketing using PowerPoint. It comes with SocioTuber: 125+ high-quality YouTube templates via PowerPoint.
- Speechelo: Instantly Transform Any Text Into A 100% Human-sounding VoiceOver with only 3 clicks!
- StopMotionCreator: Simple 3-step process to create amazing videos. Create unlimited videos, no restrictions. Lifetime V1 updates. Create and sell for $300 to $500 each. 30-day money-back guarantee. by Andrew Darius.
- Videly: video marketing made easy, find untapped, buyer keywords, SEO optimized titles, desc & tags, any language
- Vidently: Eye-Catching Spectacular Videos That Attract Attention & Convert Visitors Into Buyers in 3 Simple Steps With The World’s First Automated Swipe & Snap Video Creator. 200 pre-made scene templates. 300+ fonts. 14-daysmoney-back guarantee. by Andrew Darius.
- VideoDyno: Create Video ads and video sales letters without writing any script or recording voice-over. 3-in-1 video sales app writes flawless ads & video sales script, creates videos & brings buyers to your funnels and websites.
- VideoGameSuite: Cloud-based gamification lead system that creates fun lead games.
- VideoMarketingBlaster: Rank on Google and YouTube. Find untapped buyer keywords, SEO optimized
- Videoowide: Drag & drop simplicity, PRO designed video templates & animation, video marketing software
- VideoPal: Create stunning 3D, 2D, human-talking avatars in seconds
- VideoReel: Create Jaw-Dropping Videos For Social-Media & Ads In Just 3 Clicks!
- VideoRobot: 300 ready-made video templates, Flexible black video canvas, Award-winning text-to-speech with one-click translation.
- Vidicious: Attention Commanding, Studio-Grade Intros, Deluxe Logo Sting Animations, Incredible Outros, In Just A Few Clicks.
- VidScribe: Transcribe, translate, and redub your videos in local languages in just a click.
- VidSnatcher: Create online courses, training videos, eLearning videos, video lessons, meeting recording, YouTube videos, presentation recordings
- VidToon: #1 Top Video Animation Software To Make Explainer, Marketing, Animated Videos Online. HD Background Images and Music Files-Automated Voice Overs-Smart Timeline-Social Media-Animate Text-FHD Export-Camera Zoon In/Out-GIFs & Icons-Transitions, and more.
- ViralVideoMonetizer: Cloud-Based software to monetize You-Tube videos by sharing them on social sites
- VSLcreator: Unleash FREE Traffic, Leads & Sales With The Industry’s Fastest Drag & Drop Software For UNLIMITED Sales Videos & Marketing Scripts.
- WebinarControl: A webinar template that will let you create truly powerful webinar presentations using the proven Intro, Story, Body, Offer, and Close methodology.
- WebinarJam: All-in-One Webinar Platform. Cloud-based broadcasting technology, Up to 5,000 attendees, Up to 6 presenters, All devices in HD glory, Live chat, Private chat, Sticky announcements, Questions & answers, Automated recordings, Replica replays, Flexible scheduling, and so much more. About: by Genesis Digital LLC. OVERVIEW.
- XpressionCamera: Give yourself a virtual makeover for your video chats and live streams.
SPONSORED
CREATESTUDIO
3D Animated Videos in Minutes
Features:
- 3D character creator
- Automatic lipsyncing
- Commercial use license
- Drag and drop editor
- Unlimited video exports
- Doodle video creator
- Easy to use
- Scroll stopping video ads
What you can create:
- Sales videos
- Real estate
- Stories & reels
- Course content
- Agency client signups
- Interface animations
- Social ads
- YouTube content
- Website explainers
- Reviews ads
- and much more
Bonuses: 100x social media scroll stoppers, 2D explainer video set, bobble head builder, doodle video builder, video ad promo pack, clay scene builder,
About: 40,000 users worldwide, 170 countries, 4.8 (capterra, trustpilot, g2) reviews, 20,000 FB community, a software product of Vidello Limited.
SPONSORED
DOODLY

Video Creation Software
Features:
- Unlimited whiteboard videos
- Blackboard, glassboard, and green screen animations
- Smart Draw Technology: upload your images and create point-and-click custom draw paths
- Large selection of male and female hand types in various ethnicities.
- Record your own custom voiceover audio directly within Doodly, and easily sync it to your sketch.
- NO stock images or photos: Custom drawn by a professional graphic artist team.
- 200 total characters and 20 different poses each.
- 20 different background scenes
- 1000s of custom-drawn whiteboard doodle images
- Royalty-free audio music tracks
- Install it on as many computers as you like
- Export your doodle sketch videos in various mp4 file sizes from web-ready, all the way to full 1080p HD.
- Free software updates
- 30-day, money-back guarantee.
What you can create:
- YouTube videos
- Teaching and training
- Facebook advertising
- Sales videos (VSLs)
- Fun and inspiring videos
- Hundreds of additional uses
Bonuses: Doodly is part of the Voomly family.
About: by Russell Brunson, founder of ClickFunnels.
SPONSORED
FLEXCLIP
Video Maker
Main slogan: creates marketing videos and family stories in minutes.
Products:
- Video editor,
- Movie maker,
- Slideshow maker,
- Screen recorder
Features:
- 1,000s of templates: business, store, intro/outro, community, sport, wedding, slideshow, marketing, and so much more.
- Streamline the Video Creation Process with AI.
- AI text to video,
- AI video script,
- AI image generator.
- Built-in resources: 1,000+ text animations and preset styles, millions of dynamic vector elements, rish transitions and overlays.
- 4M+ royalty-free stock assets. Collaborate on Video Editing and Share Seamlessly.
- Tools: trim/cut, text, music, AI auto subtitle, motion graphics, record screen, aspect ratio, GIF maker, remove background, and so much more.
Other departments: Various resources, training, and support.
About: by PearlMountain – 10M+ users, 2M+ registered users, 5M+ video downloads.
SPECIAL COUPON – 10% OFF Any Plan with CODE: FLEXCLIP10.
SPONSORED
MANYCAM

Live Video Made Better
Main slogan: an easy-to-use virtual camera and live streaming software that helps you deliver professional live videos on streaming platforms, video conferencing apps, and remote learning tools.
Products:
- Mobile app
- ManyCam Lite
- ManyCam 9 Beta
- Virtual Backgrounds SDK
Features:
- Multiple video sources
- Layers
- Picture-in-picture
- Titles
- Virtual webcam
- Export & import presets or projects
- Web source
- YouTube integration
- Effects
Other departments: Blog, community, help, FAQ, guides.
About: Founded in 2006, Montreal, CA.
SPONSORED
TOONLY
Drag n Drop Explainer Video Creator
Features:
- Easy-to-use, intuitive interface
- Massive library: tons of characters, props, and backgrounds
- NO stock images: only custom drawn by a professional graphic design team.
- 200 characters, 20 different poses each.
- 81 different backgrounds.
- Premade scenes
- Record your own custom voiceover audio, easily sync it to your toonly video
- 20 royalty-free music tracks
- Install it on multiple computers
- Free software updates
- Export unlimited HQ videos in various mp4 sizes
- 30-day money-back guarantee
Who is it for: Small business owners, service providers, eCommerce stores, digital marketers, IT, human resources, trainers & presenters, B2B sales, nonprofits
What else you can create:
- Homepages
- Landing pages
- Facebook advertising
- Social media campaigns, contests, competitions, etc.
- Sales videos (VSLs)
- Crowdfunding campaigns
- Product pages
- Presentations & training
- Emails
Bonuses: Toonly is part of the Voomly family.
About: by Russell Brunson, founder of ClickFunnels.
SPONSORED
VIDDYOZE

Video Animation Platform
Main slogan: Create Incredible Videos For Your Business Or Brand In Minutes With The Most Powerful Video Creator On The Planet.
Products:
- General: animations, cartoons, general videos, montages, slideshows, trailers
- Business: corporate, educational explainer, marketing, promo, training, video ads, wedding, testimonial, website VSL, affiliate reviews
- Technical: intros, logo animation, lower thirds, outros, stinger transitions, transitions
- Social Media: FB ads, FB videos, Instagram, TikTok, Twitch, Twitter, YouTube
Features:
- Script, storyboarding, finding assets, audio, and animation done for you
- 1,000s of video templates: logo animations, intros & outros, live action animations, video transitions, lower thirds & call outs, social animations, promo templates, user generated animations,
- Brand library: Add your brand name, logo, colour pallet, testimonials, imagery, and more to the library and the Viddyoze will select the appropriate details to add to every video you make in 1 click.
- Auto-populate: 1 click auto populates every single template with your brand, speeding up creation by 10x.
- TrustPilot integration
- Fine Tune Recipes: Choose a video recipe then fine tune it to meet your exact demands before letting the AI work its magic
- Colours
- Text & fonts
- Images: You can further personalise your video by removing the AI chosen images and replacing them with your own
- Scenes & animations
- Bake from scratch
- Save recipe
- Smooth, slick workflow
- Universal MP4
- Ultra-fast servers
- Easy aspect ratios
- Intagrations with Pexels, Pixabay
- Watermarks
- Detailed video analytics
- 3-click video animations
- Unrivalled customer support
- Unlimited amount of videos
- NEW templates every month
- Royalty-free images and videos
- In-app image and video editing
- Active Discord and Facebook groups
- Create videos for commercial use (including reselling)
- Editing: cut or move scenes, adapt images, change fonts and palettes, add custom audio, insert logo stinger, adjust styles,
- Marketing: lead magnets, upsell videos, contents and quizzes, social engagement, seasonal promos, story videos, special offers, tutorials, event announcements, resumes, onboarding videos, general reviews, text based testimonials, recruiting videos, about us, general announcements, product catalogues, product sales, dynamic testimonials, top 10 videos, teasers, surveys.
Other departments: Academy to help you build video marketing strategies that will turbocharge your business growth (every month, new training), blog, White Label video program, labs – beatwave (YouTube audio visualiser, music visualiser).
About: by David Chamberlain, Jamie Garside, Joey Xoto. 250K+ businesses helped.
SPONSORED
VOOMLY

Video Funnel Creator & Automation
Features:
- Video hosting at a fraction of the cost
- Faster load times
- The ‘Invisible’ Squeeze Player
- The ‘Silent Salesman’ Video Funnel
- Interactive Video Closer
- Advanced Analytics
- Custom Branding
- Video Time Stamps
- and more
Who is it for:
- Digital marketers
- Content creators
- Video marketing agencies
- eCommerce & online store builders
Bonuses:
- Doodly: the simplest whiteboard animation software
- Toonly: cartoon explainer video creation software
- Pyks: professional eCover creation software
- People Builder: create super-cool, custom characters for your Doodly videos in minutes
- Talkia: realistic-sounding text to speech software
Integrations: ActiveCampaign, Mailchimp, ClickFunnels, GetResponse, ZohoMail, Klaviyo.
About: by Russell Brunson, founder of ClickFunnels.

— It's The Divi Anniversary Sale!
ELEGANT THEMES
🚀 Get Up To 78% Off For A Limited Time!
💡 Today is the best day to join 974,872 Divi users and lock in our biggest discount on the world's most popular premium WordPress theme and Visual Builder. We only offer these discounts once per year!
This advertisement is sponsored. For more information, I refer you to the disclaimer page.
Some of the links on this page are "sponsored". For more information, I refer you to the Disclaimer page
Hi Tasos,
A helpful and Hefty list! Thanks for sharing 🙂
Wanted to also suggest branition colors. A collection of color palettes hand curated specifically for branding.
Hi Hossein.
Thanks so much for contacting us and for the recommendation. We’ll happily add your brand to our catalog. There’s a small fee. We’ve sent you an email with the details to discuss it further.
All the best
Just want to suggest BEAUBUS Patterns (A set of 150+ free SVG patterns for you to use on your projects.): patterns.beaubus.com
Hi Andrew
Thanks so much for letting me know about this awesome resource. I added your brand to the catalog.
Best wishes